
- Home to LMIC
- Virtual Labor Market Data System
- Career Exploration & Planning
- Consumer Price Index
- Demographics
- Economic Snapshot
- Employee Benefits
- Employment Projections
- Labor Force & Unemployment
- Labor Supply
- Overview of the Current Labor Market
- Surveys We Conduct
- Wages & Income
- Workers by Industry
- Tools & Resources
- Publications
- References
- What's New
- Can't Find It?
South Dakota e-Labor Bulletin
June 2023
Navigating through South Dakota employment and wage data
to find the destination data you need
 Since summer is here, the most popular season for South Dakota road trips, we’d like to take you on a different kind of journey. We hope our travel itinerary will help you learn the lay of the land so you can easily find valuable workforce data when you need it.
The landscape we’ll be traveling through is the annual report of South Dakota employment and wages in 2022, a comprehensive compilation of data produced through the Quarterly Census of Employment and Wages (QCEW) program the Labor Market Information Center conducts jointly with the U.S. Bureau of Labor Statistics.
An aerial view of this annual report shows the following are included:
- Employment data – number of employees
- Wages – weekly and annual pay data
- Ownership – Data is available for privately owned industries as well as government entities at each of the three levels: federal, state and local.
- Industry detail – Data is published for each of South Dakota’s three-digit industries as classified in the North American Industry Classification System (NAICS). Learn more about NAICS. But that is just the drive-by view. For the more serious adventurer, there’s a complete overview of each industry, with narrative analysis and graphs.
- Employer size class (the only source of such data)
Do you stop to read historical markers when you travel? This journey offers that opportunity too. These annual reports are readily available on this website back to 2004. Printed summaries are available back to 1980 in LMIC’s archives. Quarterly and annual QCEW data are available in the virtual labor market data system back to 2001. Historical data allows for valuable comparisons over time to identify trends and changes in the labor market—the view from the horizon, if you will.
Touring the Annual Report
Take your fingers on a tour of what’s available in the 2022 annual report of employment and wages, starting from our menu page. We’ve listed (and linked) the destination options below. We've also included a screenshot of an example of what you’ll see at one of the more popular destinations.
If you’re up to a challenge at the end of the journey, try the scavenger hunt we’ve planned. See if you can find the answers to the challenge questions.
- Introduction
- Statewide Information
- Covered Workers & Annual Pay Table
- Summary of South Dakota Covered Workers & Annual Pay
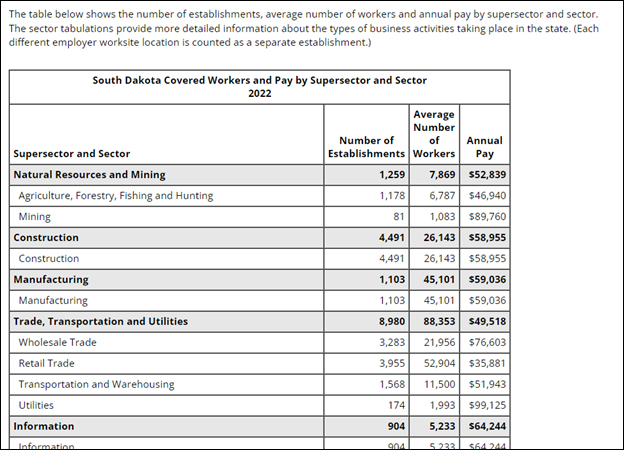
- Establishments, Workers & Annual Pay Table (See screenshot below.)
- Narrative Analysis with Tables & Graphs, by Supersector
- Covered Workers & Annual Pay by Establishment Size
- County Information
- Covered Workers by County
- Annual Pay for Covered Workers by County
- Establishments, Private Ownership Only, by County and Size
- Metropolitan Statistical Area (MSA) Information
Screenshot of an example from the Establishments, Workers & Annual Pay Table
For Assistance or More Information
If you'd like assistance finding information in the 2022 annual report of QCEW data or have questions, please contact us.
Ready for a challenge? Try our Scavenger Hunt
- Find the percentage of wage and salaried, civilian workers encompassed in the Quarterly Census of Employment and Wages. (Hint, check the Summary of South Dakota Covered Workers & Annual Pay page.)
- Find how many South Dakota workers were employed by private establishments in 2022. (Hint, look in either the Covered Workers and Annual Pay table or the Summary of South Dakota Covered Workers & Annual Pay page.
- Find the only South Dakota private industry with a worker loss from 2021 to 2022. (Hint, the easiest way to see the answer is probably the bar graph on the Summary of South Dakota Covered Workers & Annual Pay page.)
- How many Manufacturing establishments did South Dakota have in 2022? (Hint, check the Establishments, Workers & Pay table.)
- What was the annual average pay for South Dakota’s Specialty Trade Construction Contractors in 2022? (Hint, check the Narrative Analysis with Tables & Graphs, by Supersector page on Construction.)
- How did South Dakota’s Health Care and Social Assistance industry supersector rank among other industries in terms of employment and annual pay in 2022? (Hint, check the Narrative Analysis with Tables & Graphs, by Supersector page on Health Care and Social Assistance.)
- Which South Dakota industry supersector has the most large establishments (500 or more workers each)? (Hint: check the data table on the Covered Workers & Annual Pay by Establishment Size page.)
- How many covered workers did Lake County, South Dakota have in 2022? (Hint: Check the data table on the Covered Workers by County page.)
- What county had the greatest percent increase in average annual pay from 2021 to 2022? (Hint: Check the table on the Average Annual Pay by County page.)
- Which of South Dakota’s Metropolitan Statistical Areas (MSAs) has more small (less than 10 employees each) Construction establishments, Rapid City or Sioux Falls? (Hint: You’ll need to look at both the Rapid City and Sioux Falls MSA Establishment Size & Supersector pages.)