
- Home to LMIC
- Virtual Labor Market Data System
- Career Exploration & Planning
- Consumer Price Index
- Demographics
- Economic Snapshot
- Employee Benefits
- Employment Projections
- Labor Force & Unemployment
- Labor Supply
- Overview of the Current Labor Market
- Surveys We Conduct
- Wages & Income
- Workers by Industry
- Tools & Resources
- Publications
- References
- What's New
- Can't Find It?
South Dakota e-Labor Bulletin
September 2025
Manufacturing in the spotlight
In honor of National Manufacturing Week, we’re spotlighting the sector’s role in the state’s economy.
There are 1,086 Manufacturing establishments in South Dakota. They employ 45,085 people, accounting for 11.8% of total private sector employment in 2024. The sector paid over $2.8 billion in wages in 2024 (12.8% of private industry payrolls). Annual pay for Manufacturing workers averaged $63,418 in 2024.
In terms of output, the Manufacturing sector produced $5.7 billion worth of product in 2024, accounting for 7.6% of the state’s Gross Domestic Product.
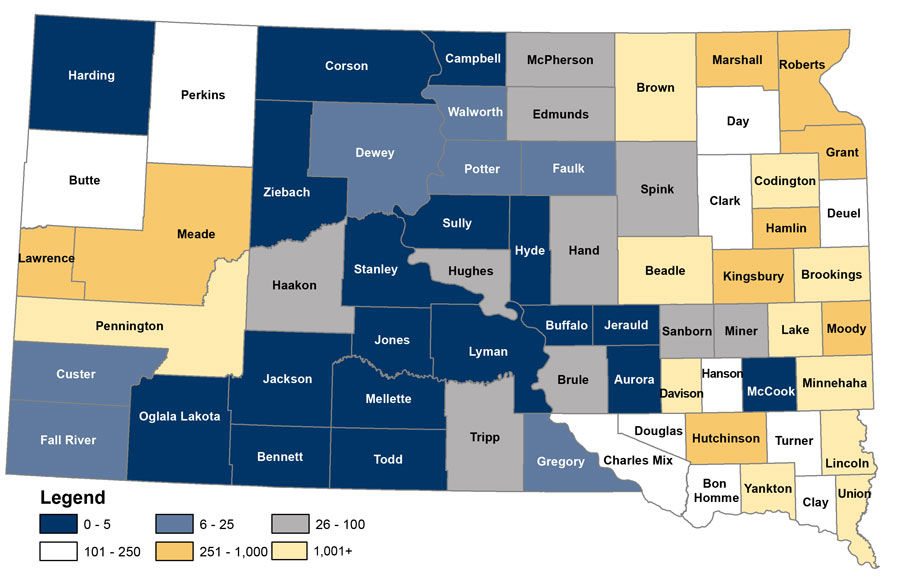
Manufacturing across the state
The map below shows the number of South Dakota manufacturers in 2024 by county. The map is color coded by the number of Manufacturing employers by county. Please note: the 0-5 category includes counties for which the data is confidential.
Manufacturing’s past
Manufacturing made its first measurable appearance in South Dakota in the 1970s. The economy expanded from a primarily agricultural economic base to include an industrialized nonfarm sector. Small, labor-intensive manufacturing businesses started all over South Dakota. These manufacturing firms provided jobs for the many women entering the labor force—some the wives or daughters of farmers and ranchers. By 1975, Manufacturing employed 19,548 people. Some small manufacturing firms closed during the later 1970s but others rapidly expanded. By 1979, 27,125 South Dakotans were employed in Manufacturing.
In the early 1980s, South Dakota banking laws were liberalized to remove interest rate caps. This allowed South Dakotans to borrow and invest nationally and internationally instead of just locally. This economic globalization created new market opportunities for South Dakota manufacturers. This was an important time for South Dakota’s economy in general. Workers produced goods and services not only to sustain the state's citizens, but enough to export nationally and internationally as well. Unfortunately, this also made the state’s labor market, including the Manufacturing sector, more susceptible to two back-to-back national recessions in the early 1980s.
After stabilizing, South Dakota Manufacturing employment had reached 27,428 by 1985. By 1990, employment in Manufacturing was 33,504 and reached 43,804 by 2000. There have been some declines since, but by 2024, Manufacturing employment in the state reached a new high of 45,085. That’s growth of nearly 131% over the last 49 years.
South Dakota’s Manufacturing employment increased by 1,954 (4.5%) over the last five years, even though there are 21 fewer establishments than five years ago (a 1.9% decline). The subsectors contributing the most growth from 2020 to 2024 were:
- Fabricated Metal Product Manufacturing (NAICS 332): 760 workers (20.8%)
- Transportation Equipment (NAICS 336): 417 workers (12.4%)
- Plastics and Rubber Products Manufacturing (NAICS 326): 291 workers (19.3%)
- Food Manufacturing (NAICS 311): 270 workers (2.5%)
- Chemical Manufacturing (NAICS 325): 201 workers (18.9%)
Currently in Manufacturing
There are currently more than 760 job opportunities being advertised in the state’s Manufacturing industry. The range of skills employers are most highly seeking for those openings shows the diversity of roles workers play. In-demand skills range from customer service and mathematical skills to welding and preventive maintenance.
Manufacturing’s future in South Dakota
South Dakota’s Manufacturing industry is projected to add 2,812 workers by 2032 (from a level of 45,101 in 2022 to 47,913 in 2032, a 6.2% increase). The subsectors projected to grow the most are Transportation Equipment Manufacturing and Plastics and Rubber Products Manufacturing.
| South Dakota Manufacturing Employment Projections 2022-2032 By Three-digit NAICS* Industry Subsector |
|||||
| NAICS* Code |
Industry Title |
2022 Employment |
2032 Employment |
Numeric Change |
Percent Change |
| Total, All Industries | 511,117 | 550,566 | 39,449 | 7.7% | |
| Total, Manufacturing Sector | 45,101 | 47,913 | 2,812 | 6.2% | |
| 311 | Food Manufacturing | 10,984 | 11,867 | 883 | 8.0% |
| 312 | Beverage and Tobacco Product Manufacturing | 320 | 357 | 37 | 11.6% |
| 314 | Textile Product Mills | 638 | 680 | 42 | 6.6% |
| 321 | Wood Product Manufacturing | 2,146 | 2,239 | 93 | 4.3% |
| 322 | Paper Manufacturing | 679 | 659 | -20 | -2.9% |
| 323 | Printing and Related Support Activities | 1,354 | 1,290 | -64 | -4.7% |
| 325 | Chemical Manufacturing | 1,138 | 1,235 | 97 | 8.5% |
| 326 | Plastics and Rubber Products Manufacturing | 1,617 | 1,813 | 196 | 12.1% |
| 327 | Nonmetallic Mineral Product Manufacturing | 1,688 | 1,812 | 124 | 7.3% |
| 331 | Primary Metal Manufacturing | 630 | 673 | 43 | 6.8% |
| 332 | Fabricated Metal Product Manufacturing | 4,085 | 4,320 | 235 | 5.8% |
| 333 | Machinery Manufacturing | 6,045 | 6,417 | 372 | 6.2% |
| 334 | Computer and Electronic Product Manufacturing | 2,324 | 2,401 | 77 | 3.3% |
| 335 | Electrical Equipment, Appliance, and Component Manufacturing | 419 | 448 | 29 | 6.9% |
| 336 | Transportation Equipment Manufacturing | 3,777 | 4,304 | 527 | 14.0% |
| 337 | Furniture and Related Product Manufacturing | 2,233 | 2,286 | 53 | 2.4% |
| 339 | Miscellaneous Manufacturing | 4,965 | 5,058 | 93 | 1.9% |
| Notes: *NAICS - North American Industry Classification System Data is preliminary and subject to revision. Industries with 2022 employment less than 200 not included. May not sum due to rounding and the inclusion of non-publishable industry data in the totals. Learn more about the employment projections methodology. Source: Labor Market Information Center, South Dakota Department of Labor and Regulation, September 2025 |
|||||
Two manufacturing subsectors fall among the top 10 industries projected to grow the fastest to 2032: Transportation Equipment Manufacturing and Plastics and Rubber Products Manufacturing.
Transportation Equipment Manufacturers produce equipment for transporting people and goods. They use production processes similar to those of other machinery manufacturing establishments such as bending, forming, welding, machining, and assembling metal or plastic parts into components and finished products such as motor vehicle bodies, trailers and parts for such equipment. Consumer demand in the past couple of years (2020-2022) drove increased production. According to the South Dakota Department of Revenue’s Sales and Use Tax Report, the annual gross sales for Transportation Equipment in South Dakota rose 64.4% from 2020 to 2022. As businesses and consumers continue to purchase products from establishments in this subsector (aerospace parts, motor vehicle parts and accessories, trailers, motorcycles, and boats), more workers will be needed to increase production and meet demand.
Businesses in the Plastics and Rubber Products Manufacturing subsector process plastic materials and/or raw rubber. Plastics and rubber are combined in the same sector because plastics are increasingly being used as a substitute for rubber; however, the subsector is generally restricted to products made of just one material, either solely plastics or rubber. Gross sales have risen in the past couple of years in the Rubber and Miscellaneous Plastic Products major group, according to the Department of Revenue’s Sales and Use Tax Report. From 2020 to 2022 gross sales were up 37.9%. Manufacturing facilities within this subsector continue to increase production to keep up with increasing demand for products such as foam insulation, plastic bags, plastic pipes, plastic bottles, rubber tires, rubber hoses, and rubber belts.
Visit our website for more analysis of industry projections to 2032.
For more information
The data incorporated above are just a few examples of the type of workforce information available from the Labor Market Information Center. For additional labor market information, contact us.