- Home to LMIC
- Virtual Labor Market Data System
- Career Exploration & Planning
- Consumer Price Index
- Demographics
- Economic Snapshot
- Employee Benefits
- Employment Projections
- Labor Force & Unemployment
- Labor Supply
- Overview of the Current Labor Market
- Surveys We Conduct
- Wages & Income
- Workers by Industry
- Tools & Resources
- Publications
- References
- What's New
- Can't Find It?
South Dakota e-Labor Bulletin
July 2023
Consumer Price Index: An Inside Look at Average Price Data
Many types of data are published as outputs from the Consumer Price Index (CPI) program. The most popular datasets are the index values of a population and area and their yearly or monthly percentage change, which we covered in our January 2022 Labor Bulletin article.
But have you ever wanted to know much the average consumer pays for specific goods? Does it seem like the price of something you pay for on a routine basis (like the jug of milk you put in your grocery cart or your monthly gas bill) keeps creeping up, and you wonder if anyone tracks these price changes over time?
With the release of the CPI each month, the Bureau of Labor Statistics (BLS) also publishes average prices for select utility, automotive fuel, and food items at the national level (United States city average). If the sample size is sufficient, all average prices are also published at the regional level. Average price data serves a different purpose than CPI indexes. They are simply estimates of the average price paid by the consumer for goods.
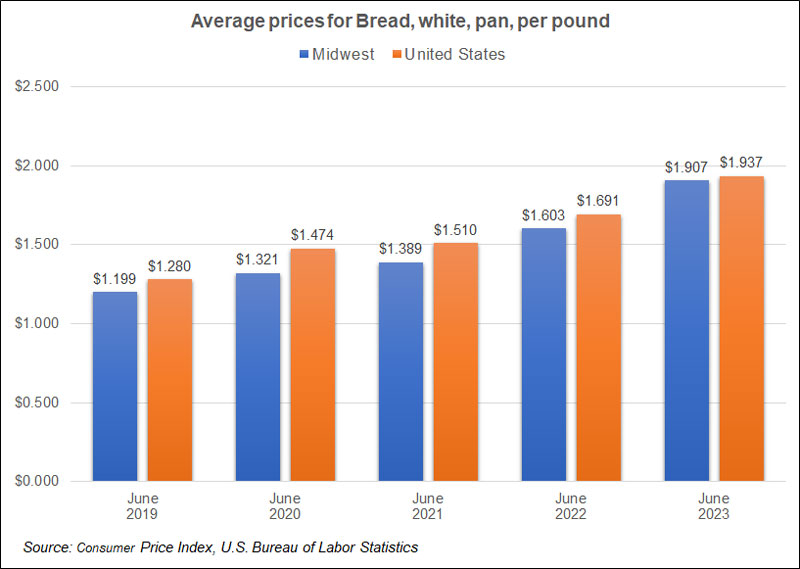
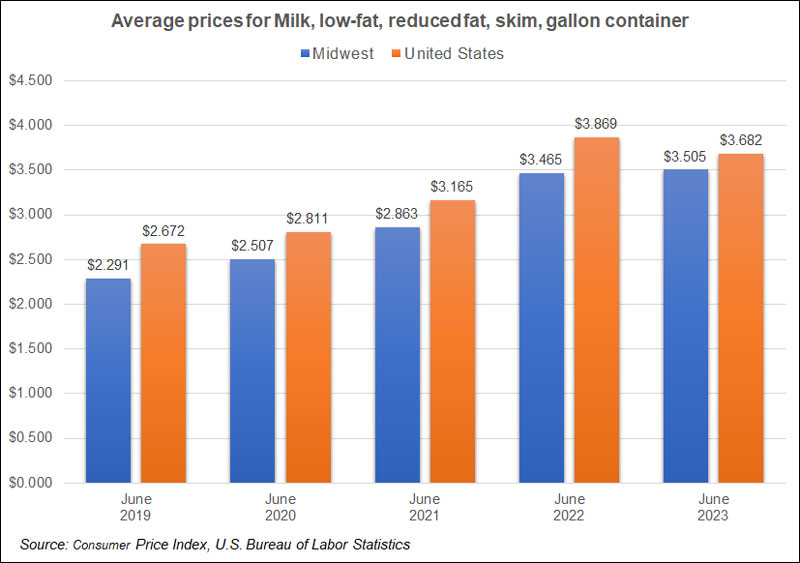
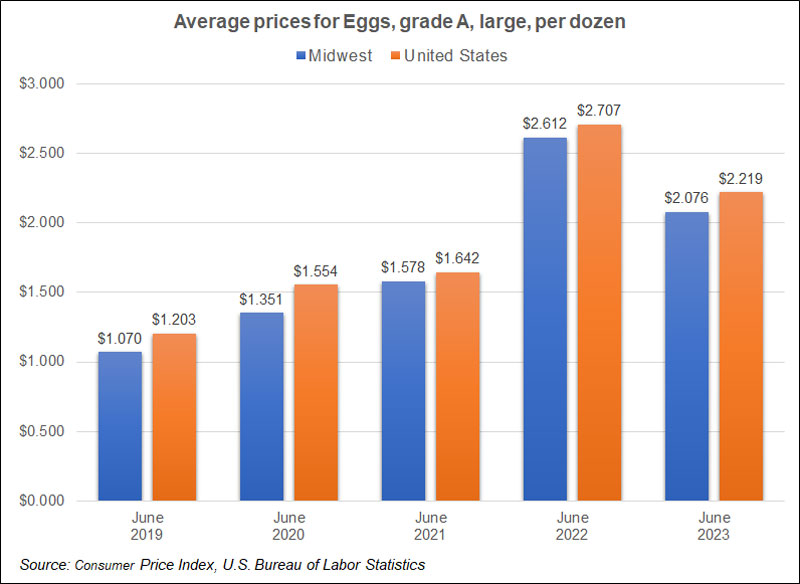
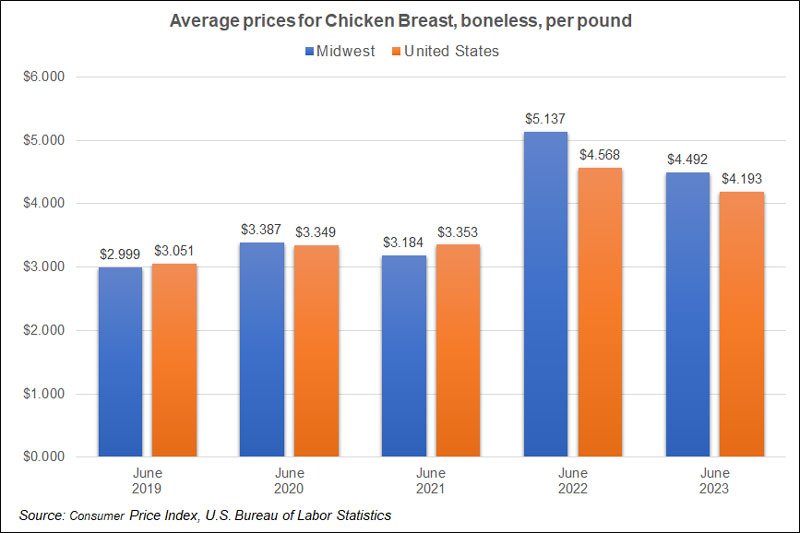
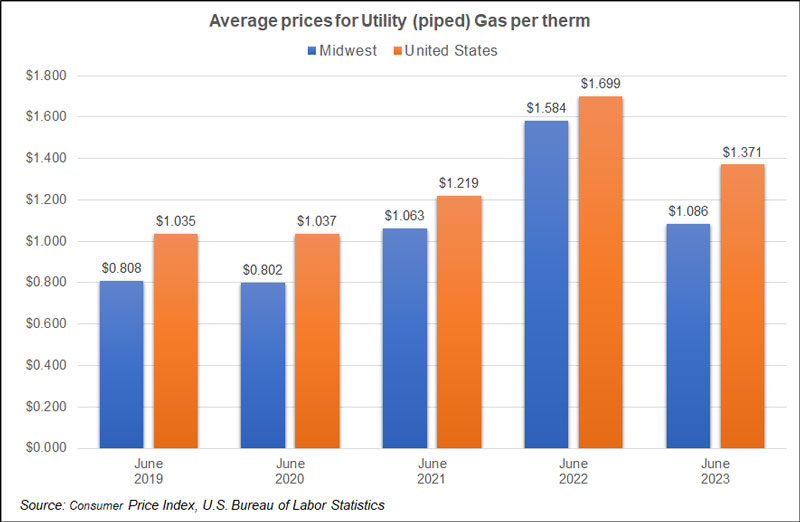
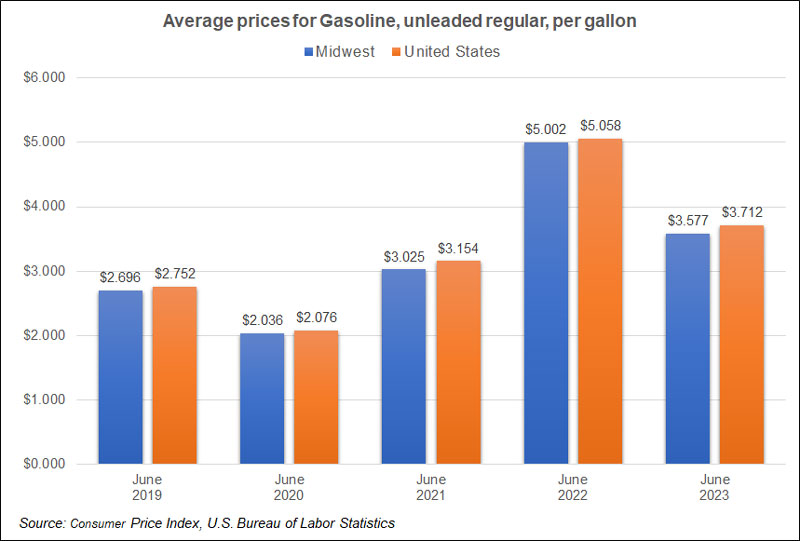
Six food and energy items (listed below) were selected to see how much prices fluctuated over the past five years.
- Bread, white, pan, per lb.
- Milk, low-fat, reduced fat, skim, gallon container
- Eggs, grade A, large, per dozen
- Chicken breast, boneless, per lb.
- Utility (piped) gas per therm
- Gasoline, unleaded, regular, per gallon
Since price data was available at the regional level, a comparison of the U.S. city average and the Midwest Region is also shown.
The prices of food items (such as bread and milk) are often set by supply and demand and generally increase at a steady rate. However, unlikely events can cause price volatility, such as the bird flu in 2022 which caused a large shortage of poultry in the United States. The graphs show the effects for eggs and boneless chicken breast. Prices for energy items are much more dependent on policy. Note the regional differences for utility gas and large over-the-year changes in unleaded gasoline.
For Assistance or More Information
More information on the Consumer Price Index can be found on our CPI menu page. We recommend visiting the CPI menu on the BLS website to find more available price data. If you need assistance or prefer we provide CPI data to you, contact us. We’re here to help.
