- Home to LMIC
- Virtual Labor Market Data System
- Career Exploration & Planning
- Consumer Price Index
- Demographics
- Economic Snapshot
- Employee Benefits
- Employment Projections
- Labor Force & Unemployment
- Labor Supply
- Overview of the Current Labor Market
- Surveys We Conduct
- Wages & Income
- Workers by Industry
- Tools & Resources
- Publications
- References
- What's New
- Can't Find It?
Labor Market Information Center
2024 Annual Report
Quarterly Census of Employment and Wages
The table below shows annual pay for covered workers by county for 2023 and 2024. The county with the highest annual pay for 2024 was Union County at $73,275.
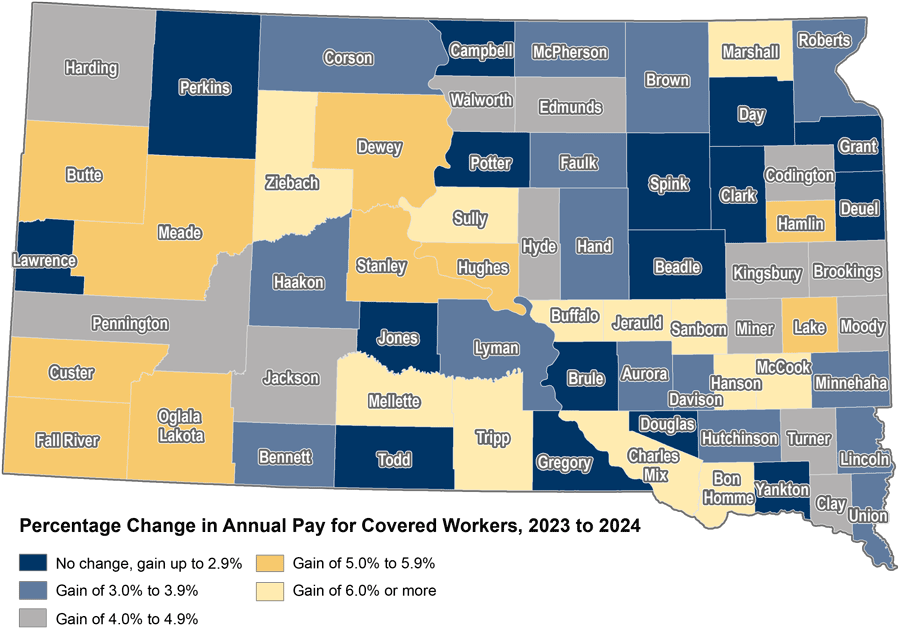
All of South Dakota’s counties experienced increases in annual pay. The highest percentage gains occurred in Ziebach, Jerauld, and Sully counties. The largest actual numeric gains occurred in Ziebach, Sully, and Marshall counties.
The map below the table illustrates the percentage change in annual pay by county from 2023 to 2024.
| Annual Pay for Covered Workers by County 2023 and 2024 |
||||||||
| County | 2023 | 2024 | Percent Change | County | 2023 | 2024 | Percent Change | |
| Aurora | $40,365 | $41,851 | 3.7% | Hyde | $52,578 | $55,062 | 4.7% | |
| Beadle | $49,455 | $50,490 | 2.1% | Jackson | $39,505 | $41,338 | 4.6% | |
| Bennett | $41,091 | $42,488 | 3.4% | Jerauld | $43,775 | $47,595 | 8.7% | |
| Bon Homme | $42,925 | $46,360 | 8.0% | Jones | $35,136 | $35,355 | 0.6% | |
| Brookings | $54,400 | $56,993 | 4.8% | Kingsbury | $45,857 | $47,848 | 4.3% | |
| Brown | $52,565 | $54,431 | 3.5% | Lake | $54,080 | $56,798 | 5.0% | |
| Brule | $40,591 | $41,127 | 1.3% | Lawrence | $49,534 | $50,202 | 1.3% | |
| Buffalo | $47,802 | $50,972 | 6.6% | Lincoln | $63,085 | $65,125 | 3.2% | |
| Butte | $43,363 | $45,790 | 5.6% | Lyman | $36,520 | $37,706 | 3.2% | |
| Campbell | $44,729 | $44,871 | 0.3% | McCook | $47,157 | $50,588 | 7.3% | |
| Charles Mix | $44,772 | $47,614 | 6.3% | McPherson | $40,358 | $41,790 | 3.5% | |
| Clark | $46,489 | $46,785 | 0.6% | Marshall | $50,975 | $55,083 | 8.1% | |
| Clay | $46,626 | $48,927 | 4.9% | Meade | $54,218 | $57,251 | 5.6% | |
| Codington | $50,053 | $52,140 | 4.2% | Mellette | $34,291 | $36,827 | 7.4% | |
| Corson | $46,373 | $48,181 | 3.9% | Miner | $41,692 | $43,506 | 4.4% | |
| Custer | $45,010 | $47,497 | 5.5% | Minnehaha | $62,688 | $65,101 | 3.8% | |
| Davison | $51,694 | $53,293 | 3.1% | Moody | $50,672 | $53,171 | 4.9% | |
| Day | $43,775 | $44,893 | 2.6% | Oglala Lakota | $50,692 | $53,580 | 5.7% | |
| Deuel | $51,845 | $53,154 | 2.5% | Pennington | $54,937 | $57,288 | 4.3% | |
| Dewey | $48,352 | $51,082 | 5.6% | Perkins | $41,125 | $41,735 | 1.5% | |
| Douglas | $45,123 | $45,567 | 1.0% | Potter | $45,795 | $46,287 | 1.1% | |
| Edmunds | $49,909 | $51,990 | 4.2% | Roberts | $43,914 | $45,280 | 3.1% | |
| Fall River | $48,598 | $51,205 | 5.4% | Sanborn | $38,545 | $41,570 | 7.8% | |
| Faulk | $41,113 | $42,502 | 3.4% | Spink | $50,081 | $51,123 | 2.1% | |
| Grant | $53,099 | $54,484 | 2.6% | Stanley | $44,654 | $46,978 | 5.2% | |
| Gregory | $39,136 | $39,943 | 2.1% | Sully | $51,309 | $55,528 | 8.2% | |
| Haakon | $46,166 | $47,546 | 3.0% | Todd | $49,046 | $49,359 | 0.6% | |
| Hamlin | $52,776 | $55,542 | 5.2% | Tripp | $46,060 | $49,589 | 7.7% | |
| Hand | $42,388 | $43,942 | 3.7% | Turner | $44,731 | $46,659 | 4.3% | |
| Hanson | $48,369 | $51,871 | 7.2% | Union | $70,969 | $73,275 | 3.2% | |
| Harding | $44,716 | $46,634 | 4.3% | Walworth | $44,575 | $46,773 | 4.9% | |
| Hughes | $58,413 | $61,735 | 5.7% | Yankton | $54,761 | $55,513 | 1.4% | |
| Hutchinson | $46,693 | $48,418 | 3.7% | Ziebach | $41,319 | $52,326 | 26.6% | |
| Data subject to revision. Produced by the Labor Market Information Center, South Dakota Department of Labor and Regulation, in cooperation with the U.S. Bureau of Labor Statistics. |
||||||||

