- Home to LMIC
- Virtual Labor Market Data System
- Career Exploration & Planning
- Consumer Price Index
- Demographics
- Economic Snapshot
- Employee Benefits
- Employment Projections
- Labor Force & Unemployment
- Labor Supply
- Overview of the Current Labor Market
- Surveys We Conduct
- Wages & Income
- Workers by Industry
- Tools & Resources
- Publications
- References
- What's New
- Can't Find It?
Labor Market Information Center
2024 Annual Report
Quarterly Census of Employment and Wages
Manufacturing Supersector
The Manufacturing supersector contains one sector, Manufacturing. Businesses within this supersector transform materials, substances or components into new products.
| South Dakota Covered Workers and Pay 2024 |
|||
| Supersector, Sector and Subsector | Number of Establishments | Average Number of Workers | Annual Pay |
| Manufacturing | 1,086 | 45,085 | $63,418 |
| Manufacturing | 1,086 | 45,085 | $63,418 |
| Food Manufacturing | 144 | 11,091 | $60,348 |
| Beverage and Tobacco Product Manufacturing | 33 | 331 | $24,667 |
| Textile Mills | 0 | 0 | $0 |
| Textile Product Mills | 22 | 618 | $52,783 |
| Apparel Manufacturing | 6 | 57 | $45,614 |
| Leather and Allied Product Manufacturing | 2 | 9 | $21,158 |
| Wood Product Manufacturing | 58 | 2,023 | $60,432 |
| Paper Manufacturing | 11 | 680 | $66,431 |
| Printing and Related Support Activities | 92 | 1,280 | $52,478 |
| Petroleum and Coal Products Manufacturing | 1 | * | * |
| Chemical Manufacturing | 37 | 1,267 | $81,677 |
| Plastics and Rubber Products Manufacturing | 47 | 1,800 | $62,286 |
| Nonmetallic Mineral Product Manufacturing | 85 | 1,793 | $77,318 |
| Primary Metal Manufacturing | 8 | 614 | $72,751 |
| Fabricated Metal Product Manufacturing | 175 | 4,408 | $59,416 |
| Machinery Manufacturing | 126 | 6,101 | $68,213 |
| Computer and Electronic Product Manufacturing | 33 | 1,917 | $57,586 |
| Electrical Equipment, Appliance, and Component Manufacturing | 15 | 487 | $59,389 |
| Transportation Equipment Manufacturing | 54 | 3,793 | $65,461 |
| Furniture and Related Product Manufacturing | 62 | 2,065 | $55,716 |
| Miscellaneous Manufacturing | 75 | 4,749 | $69,899 |
*Data was suppressed to prevent disclosure of confidential information. |
|||
Manufacturing
NAICS Sectors 31-33
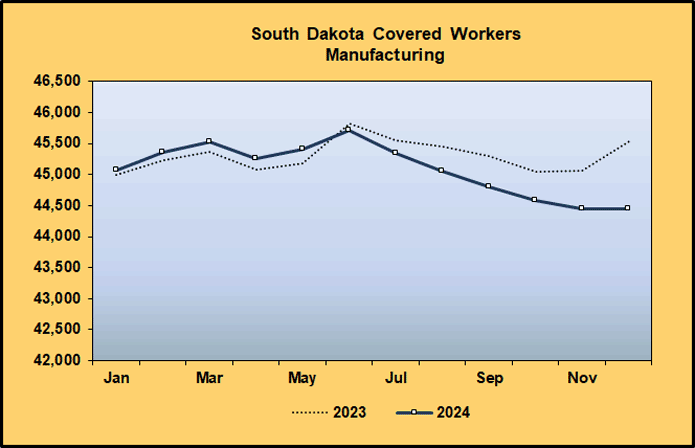
The Manufacturing sector’s employment level decreased by 216 workers (0.5%) to a new average of 45,085 in 2024. Establishments in this sector mechanically, physically, or chemically transform materials, substances, or components into new products. The goods they make may be 'durable' or 'nondurable.' Durable goods have a normal life expectancy of three or more years. These items typically have higher dollar value, such as machinery, furniture, building materials, and electronic equipment. Nondurable goods include foods and beverages, clothing, and paper products. These goods generally have a normal life expectancy of less than three years.
There were 10 subsectors that showed employment gain during 2024.
- Fabricated Metal Product Manufacturing (NAICS 332): 174 workers (4.1%)
- Food Manufacturing (NAICS 311): 147 workers (1.3%)
- Nonmetallic Mineral Product Manufacturing (NAICS 327): 88 workers (5.2%)
- Chemical Manufacturing (NAICS 325): 58 workers (4.8%)
- Textile Product Mills (NAICS 314): 16 workers (2.7%)
- Plastics and Rubber Products Manufacturing (NAICS 326): 16 workers (0.9%)
- Electrical Equipment, Appliance, and Component Manufacturing (NAICS 335): 13 workers (2.7%)
- Apparel Manufacturing (NAICS 315): 10 workers (21.3%)
- Beverage and Tobacco Product Manufacturing (NAICS 312): 2 workers (0.6%)
- Petroleum and Coal Products Manufacturing (NAICS 324): 1 worker (100.0%)
Meanwhile, 10 subsectors showed employment loss during 2024.
- Computer and Electronic Product Manufacturing (NAICS 334): -354 workers (15.6%)
- Miscellaneous Manufacturing (NAICS 339): -117 workers (2.4%)
- Printing and Related Support Activities (NAICS 323): -77 workers (5.7%)
- Transportation Equipment Manufacturing (NAICS 336): -59 workers (1.5%)
- Wood Product Manufacturing (NAICS 321): -57 workers (2.7%)
- Machinery Manufacturing (NAICS 333): -47 workers (0.8%)
- Primary Metal Manufacturing (NAICS 331): -14 workers (2.2%)
- Furniture and Related Product Manufacturing (NAICS 337): -14 workers (0.7%)
- Paper Manufacturing (NAIS 322): -5 workers (0.7%)
- Leather and Allied Product Manufacturing (NAICS 316): -1 worker (10.0%)
Not included in either of the lists above was Textile Mills (NAICS 313). This subsector had no reported establishments or employment again in 2024. Establishments in the Textile Mills subsector transform a basic fiber into a product, such as yarn or fabric that is further manufactured into usable items such as apparel, sheets, towels, and textile bags for individual or industrial consumption.
The Fabricated Metal Product Manufacturing subsector saw the largest amount of employment growth in 2024. Establishments in this subsector transform metal into intermediate or end products. Important fabricated metal processes are forging, stamping, bending, forming, and machining, used to shape individual pieces of metal; and other processes, such as welding and assembling, used to join separate parts together.
The 2024 annual pay for the Manufacturing sector was $63,418, an increase of 3.4% compared to the 2023 level of $61,354. Annual pay increased in 16 of the 20 manufacturing subsectors. The five with the largest percentage increase are listed below.
- Computer and Electronic Product Manufacturing (NAICS 334): $4,597 (8.7%)
- Miscellaneous Manufacturing (NAICS 339): $4,900 (7.5%)
- Leather and Allied Product Manufacturing (NAICS 316): $1,308 (6.6%)
- Primary Metal Manufacturing (NAICS 331): $3,762 (5.5%)
- Electrical Equipment, Appliance, and Component Manufacturing (NAICS 335): $2,981 (5.3%)
While annual pay increased in most of the Manufacturing sector, it fell in four subsectors:
- Petroleum and Coal Products Manufacturing (NAICS 324): $48,385 (44.7%)
- Paper Manufacturing (NAIS 322): $922 (1.4%)
- Beverage and Tobacco Products Manufacturing (NAICS 312): $299 (1.2%)
- Food Manufacturing (NAICS 311): $633 (1.0%)

