- Home to LMIC
- Virtual Labor Market Data System
- Career Exploration & Planning
- Consumer Price Index
- Demographics
- Economic Snapshot
- Employee Benefits
- Employment Projections
- Labor Force & Unemployment
- Labor Supply
- Overview of the Current Labor Market
- Surveys We Conduct
- Wages & Income
- Workers by Industry
- Tools & Resources
- Publications
- References
- What's New
- Can't Find It?
Labor Market Information Center
2024 Annual Report
Quarterly Census of Employment and Wages
Summary of 2024 Trends
Number of Covered Workers
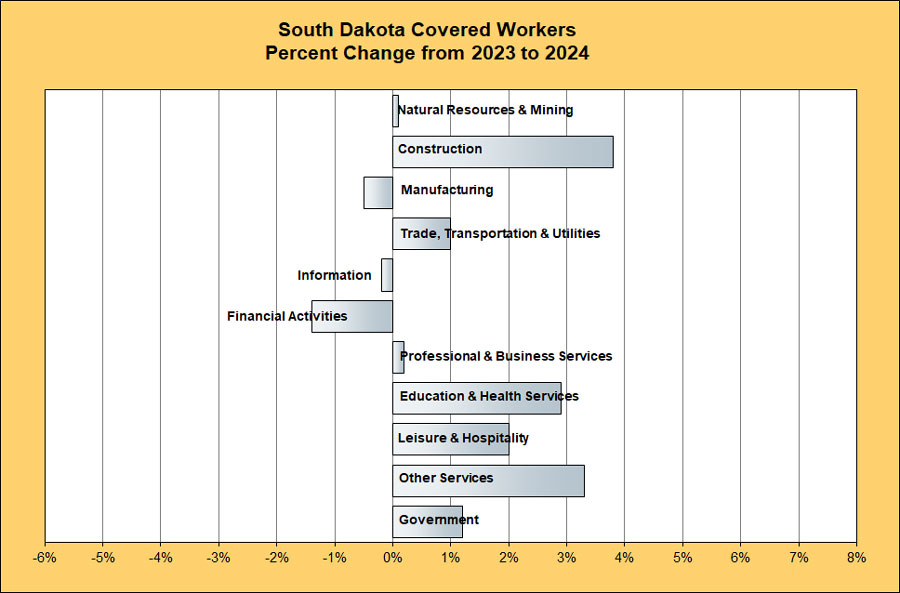
The number of employees covered by unemployment insurance in 2024 was 458,549 workers. This represents an increase of 1.3% from 2023. This chart indicates that eight supersectors showed worker gains while three supersectors decreased during 2024. The Trade, Transportation, and Utilities supersector had the highest number of workers mainly because retail trade has a high average number of employees. In 2024 the number of covered wage and salaried workers equaled 96.0% of South Dakota's wage and salaried workers. Covered workers are counted at their place of work. A person who works for more than one covered employer is counted at each job.

| Average Number of Covered Workers by Ownership and Supersector |
|||
| 2023 | 2024 | Percent Change | |
| Private Ownership | |||
| Natural Resources and Mining | 8,481 | 8,491 | 0.1% |
| Construction | 28,154 | 29,226 | 3.8% |
| Manufacturing | 45,303 | 45,085 | -0.5% |
| Trade, Transportation, and Utilities | 90,936 | 91,841 | 1.0% |
| Information | 5,139 | 5,129 | -0.2% |
| Financial Activities | 27,350 | 26,976 | -1.4% |
| Professional and Business Services | 37,238 | 37,294 | 0.2% |
| Education and Health Services | 72,218 | 74,348 | 2.9% |
| Leisure and Hospitality Services | 49,363 | 50,333 | 2.0% |
| Other Services | 12,798 | 13,220 | 3.3% |
| Total Private Ownership | 376,980 | 381,942 | 1.3% |
| Public Administration | |||
| Federal Government | 11,512 | 11,742 | 2.0% |
| State Government | 14,479 | 14,753 | 1.9% |
| Local Government | 49,721 | 50,113 | 0.8% |
| Total Government | 75,712 | 76,608 | 1.2% |
| Statewide Total | 452,693 | 458,549 | 1.3% |
| Data subject to revision. Produced by the Labor Market Information Center, South Dakota Department of Labor and Regulation, in cooperation with the U.S. Bureau of Labor Statistics. |
|||
Annual Pay of Covered Workers
Annual pay reflects total compensation paid to covered workers in the form of wages, salaries, bonuses, commission, and overtime pay during the year. Annual pay is calculated by dividing total payroll by the average number of workers. The statewide annual pay for workers covered by unemployment insurance for 2024 was $58,307. This represents an increase of 4.0% from 2023.
Annual pay is affected by the number of hours worked and the rate of pay. Full-time workers normally have higher annual pay than part-time workers do. Many of the industries with the lowest annual pay have a sizable percentage of part-time jobs. Industry specific annual pay is determined by the mix of full-time and part-time workers and high-paying and low-paying jobs. The Leisure and Hospitality supersector has the lowest industry annual pay of $23,631, because these types of businesses typically hire many part-time workers. Federal government workers have the highest annual pay at $85,214.
| Annual Pay of Covered Workers by Ownership and Supersector |
|||
| Private Ownership | 2023 | 2024 | Percent Change |
| Natural Resources and Mining | $55,282 | $57,089 | 3.3% |
| Construction | $63,962 | $67,917 | 6.2% |
| Manufacturing | $61,351 | $63,418 | 3.4% |
| Trade, Transportation and Utilities | $51,095 | $52,587 | 2.9% |
| Information | $68,104 | $69,682 | 2.3% |
| Financial Activities | $80,562 | $84,356 | 4.7% |
| Professional and Business Services | $75,555 | $78,726 | 4.2% |
| Education and Health Services | $63,171 | $65,629 | 3.9% |
| Leisure and Hospitality Services | $22,805 | $23,631 | 3.6% |
| Other Services | $44,637 | $46,436 | 4.0% |
| Total Private Ownership | $56,558 | $58,674 | 3.7% |
| Public Administration | |||
| Federal Government | $81,594 | $85,214 | 4.4% |
| State Government | $63,325 | $67,338 | 6.3% |
| Local Government | $44,322 | $46,542 | 5.0% |
| Total Government | $53,624 | $56,474 | 5.3% |
| Statewide Total | $56,067 | $58,307 | 4.0% |
