- Home to LMIC
- Virtual Labor Market Data System
- Career Exploration & Planning
- Consumer Price Index
- Demographics
- Economic Snapshot
- Employee Benefits
- Employment Projections
- Labor Force & Unemployment
- Labor Supply
- Overview of the Current Labor Market
- Surveys We Conduct
- Wages & Income
- Workers by Industry
- Tools & Resources
- Publications
- References
- What's New
- Can't Find It?
Labor Market Information Center
2023 Annual Report
Quarterly Census of Employment and Wages
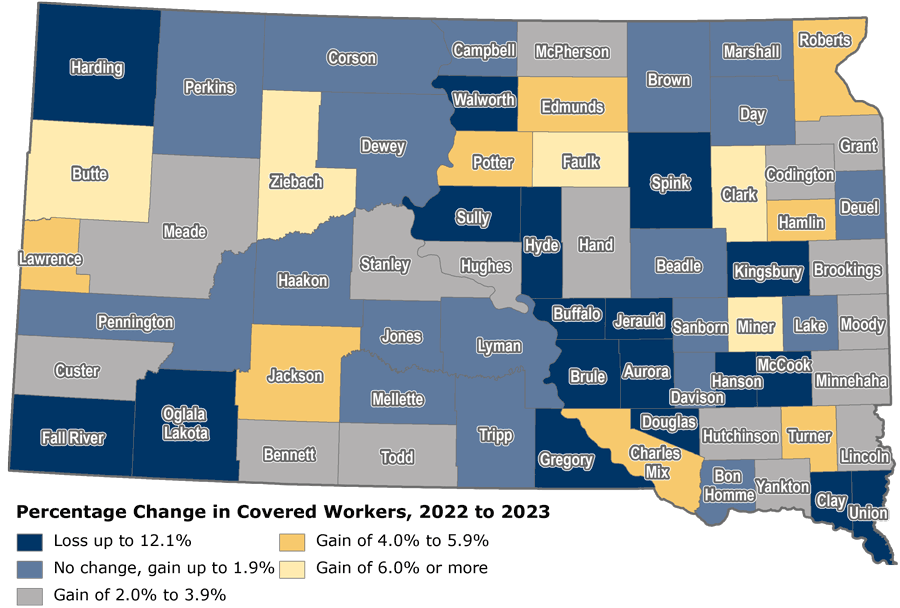
The table below indicates 71% (47) of the counties showed worker growth from 2022 to 2023. The highest percentage gains occurred in Clark, Ziebach, and Miner counties. The largest absolute gains emerged in Minnehaha, Pennington, and Lincoln counties.
Decreases in the number of covered workers occurred in 26% (17) of the counties in South Dakota. The greatest percentage decreases occurred in Jerauld, Oglala Lakota, and Harding counties. The largest absolute losses happened in Oglala Lakota, Jerauld, and Brule counties. Jones county remained unchanged.
The map below the table illustrates the percentage change in the average number of covered workers in South Dakota's counties from 2022 to 2023.
| Number of Covered Workers by County 2022 and 2023 |
||||||||
| County | 2022 | 2023 | Percent Change | County | 2022 | 2023 | Percent Change | |
| Aurora | 828 | 825 | -0.4% | Hyde | 520 | 518 | -0.4% | |
| Beadle | 8,417 | 8,575 | 1.9% | Jackson | 666 | 696 | 4.5% | |
| Bennett | 801 | 832 | 3.9% | Jerauld | 1,842 | 1,619 | -12.1% | |
| Bon Homme | 1,731 | 1,741 | 0.6% | Jones | 385 | 385 | 0.0% | |
| Brookings | 18,731 | 19,120 | 2.1% | Kingsbury | 1,844 | 1,820 | -1.3% | |
| Brown | 19,687 | 19,826 | 0.7% | Lake | 5,152 | 5,240 | 1.7% | |
| Brule | 2,148 | 2,083 | -3.0% | Lawrence | 12,833 | 13,392 | 4.4% | |
| Buffalo | 544 | 530 | -2.6% | Lincoln | 28,064 | 28,767 | 2.5% | |
| Butte | 2,733 | 2,907 | 6.4% | Lyman | 1,393 | 1,418 | 1.8% | |
| Campbell | 440 | 444 | 0.9% | McCook | 1,333 | 1,327 | -0.5% | |
| Charles Mix | 3,403 | 3,544 | 4.1% | McPherson | 551 | 564 | 2.4% | |
| Clark | 1,133 | 1,258 | 11.0% | Marshall | 1,725 | 1,758 | 1.9% | |
| Clay | 6,050 | 6,037 | -0.2% | Meade | 8,068 | 8,315 | 3.1% | |
| Codington | 16,749 | 17,080 | 2.0% | Mellette | 322 | 323 | 0.3% | |
| Corson | 722 | 725 | 0.4% | Miner | 781 | 838 | 7.3% | |
| Custer | 2,586 | 2,640 | 2.1% | Minnehaha | 131,911 | 135,596 | 2.8% | |
| Davison | 12,220 | 12,427 | 1.7% | Moody | 2,406 | 2,471 | 2.7% | |
| Day | 1,859 | 1,860 | 0.1% | Oglala Lakota | 4,162 | 3,907 | -6.1% | |
| Deuel | 1,484 | 1,503 | 1.3% | Pennington | 60,258 | 61,385 | 1.9% | |
| Dewey | 2,386 | 2,392 | 0.3% | Perkins | 1,114 | 1,115 | 0.1% | |
| Douglas | 1,005 | 1,000 | -0.5% | Potter | 781 | 813 | 4.1% | |
| Edmunds | 1,131 | 1,194 | 5.6% | Roberts | 3,401 | 3,537 | 4.0% | |
| Fall River | 2,549 | 2,500 | -1.9% | Sanborn | 628 | 640 | 1.9% | |
| Faulk | 616 | 658 | 6.8% | Spink | 2,280 | 2,272 | -0.4% | |
| Grant | 3,815 | 3,910 | 2.5% | Stanley | 1,258 | 1,294 | 2.9% | |
| Gregory | 1,579 | 1,555 | -1.5% | Sully | 684 | 682 | -0.3% | |
| Haakon | 778 | 787 | 1.2% | Todd | 2,851 | 2,919 | 2.4% | |
| Hamlin | 2,396 | 2,513 | 4.9% | Tripp | 2,245 | 2,269 | 1.1% | |
| Hand | 1,416 | 1,445 | 2.0% | Turner | 2,257 | 2,350 | 4.1% | |
| Hanson | 643 | 622 | -3.3% | Union | 9,996 | 9,953 | -0.4% | |
| Harding | 458 | 435 | -5.0% | Walworth | 2,078 | 2,045 | -1.6% | |
| Hughes | 10,712 | 10,933 | 2.1% | Yankton | 12,693 | 13,009 | 2.5% | |
| Hutchinson | 2,664 | 2,744 | 3.0% | Ziebach | 242 | 261 | 7.9% | |
| Totals may not add due to rounding. Data subject to revision. Produced by the Labor Market Information Center, South Dakota Department of Labor and Regulation, in cooperation with the U.S. Bureau of Labor Statistics. |
||||||||

