- Home to LMIC
- Virtual Labor Market Data System
- Career Exploration & Planning
- Consumer Price Index
- Demographics
- Economic Snapshot
- Employee Benefits
- Employment Projections
- Labor Force & Unemployment
- Labor Supply
- Overview of the Current Labor Market
- Surveys We Conduct
- Wages & Income
- Workers by Industry
- Tools & Resources
- Publications
- References
- What's New
- Can't Find It?
Labor Market Information Center
2023 Annual Report
Quarterly Census of Employment and Wages
Covered Workers & Annual Pay by Establishment Size
Establishment size data provides a comparison of the number of small and large businesses in South Dakota. The average number of workers at the worksite location determines establishment size. A worksite is generally defined as a single physical location at which predominantly one type of economic activity is conducted.
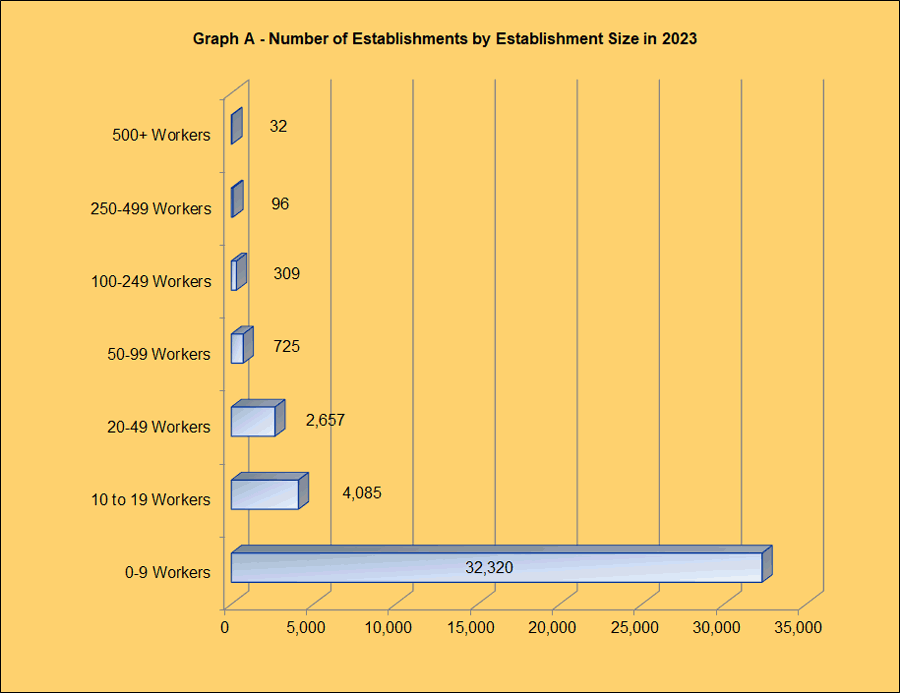
Graph A displays the number of South Dakota establishments by establishment size. This chart shows small businesses are predominate in South Dakota. During 2023 the 0-9 workers size class had the largest number of establishments, accounting for 80.4% of all establishments.

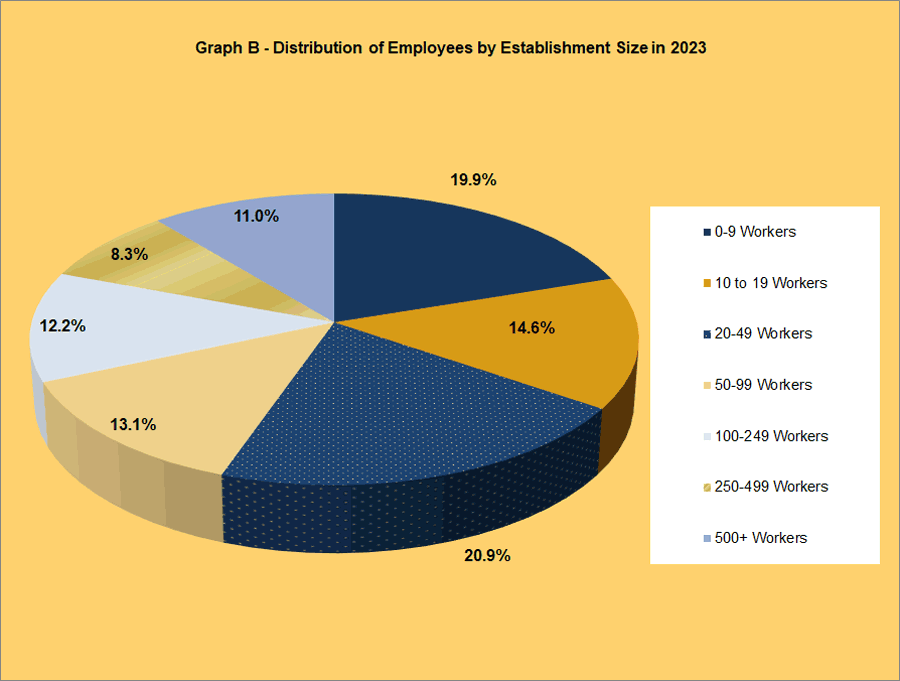
The distribution of employees by establishment size shows a different picture than the distribution of establishments. Smaller businesses have a much smaller slice of the pie. Graph B indicates smaller businesses (fewer than 10 workers) employed only 19.9% of the covered workers in South Dakota in 2023. The number of workers was evenly dispersed among the establishment size groups.

Covered Workers & Annual Pay by Establishment Size and Industry
Number of Private Establishments, Workers and Pay By Establishment Size and By Supersector 2023 |
|||||||
| Supersector | 0-9 | 10-19 | 20-49 | 50-99 | 100-249 | 250-499 | 500+ |
| Natural Resources and Mining | |||||||
| Establishments | 1,138 | 101 | 62 | 15 | 5 | 0 | 0 |
| Workers | 3,458 | 1,417 | 1,797 | 989 | 820 | 0 | 0 |
| Annual Pay | $47,199 | $51,486 | $56,660 | $60,099 | $87,099 | $0 | $0 |
| Construction | |||||||
| Establishments | 3,960 | 350 | 228 | 51 | 28 | 0 | 0 |
| Workers | 9,563 | 4,689 | 6,650 | 3,435 | 3,818 | 0 | 0 |
| Annual Pay | $50,083 | $61,960 | $72,440 | $76,953 | $74,712 | $0 | $0 |
| Manufacturing | |||||||
| Establishments | 579 | 159 | 174 | 83 | 57 | 29 | 12 |
| Workers | 1,917 | 2,188 | 5,695 | 5,754 | 9,229 | 9,402 | 11,118 |
| Annual Pay | $44,549 | $58,892 | $61,214 | $60,058 | $62,202 | $64,957 | $61,718 |
| Trade, Transportation, and Utilities | |||||||
| Establishments | 6,660 | 1,336 | 719 | 191 | 59 | 26 | 2 |
| Workers | 18,526 | 17,847 | 21,256 | 13,238 | 8,716 | 9,014 | 2,340 |
| Annual Pay | $55,419 | $47,469 | $55,684 | $55,710 | $49,979 | $35,594 | $40,555 |
| Information | |||||||
| Establishments | 847 | 56 | 43 | 9 | 3 | 1 | 1 |
| Workers | 1,225 | 756 | 1,268 | 609 | 382 | * | * |
| Annual Pay | $78,261 | $72,779 | $50,736 | $60,693 | $71,167 | * | * |
| Financial Activities | |||||||
| Establishments | 3,817 | 260 | 145 | 30 | 26 | 6 | 4 |
| Workers | 8,304 | 3,489 | 4,193 | 2,128 | 4,172 | 1,943 | 3,120 |
| Annual Pay | $69,453 | $75,234 | $90,578 | $89,155 | $92,064 | $76,484 | $83,954 |
| Professional and Business Services | |||||||
| Establishments | 8,418 | 396 | 259 | 54 | 27 | 7 | 2 |
| Workers | 12,857 | 5,226 | 7,645 | 3,712 | 3,944 | 2,057 | 1,797 |
| Annual Pay | $79,045 | $62,392 | $68,545 | $70,132 | $73,087 | $105,389 | $101,156 |
| Education and Health Services | |||||||
| Establishments | 2,499 | 463 | 353 | 137 | 64 | 25 | 11 |
| Workers | 6,178 | 6,273 | 10,638 | 9,314 | 9,357 | 7,993 | 22,466 |
| Annual Pay | $49,327 | $48,508 | $51,751 | $48,755 | $59,299 | $62,225 | $84,402 |
| Leisure and Hospitality Services | |||||||
| Establishments | 2,016 | 742 | 615 | 140 | 33 | 1 | 0 |
| Workers | 7,046 | 10,259 | 17,836 | 9,258 | 4,637 | * | 0 |
| Annual Pay | $21,199 | $20,032 | $22,574 | $24,369 | $29,249 | * | $0 |
| Other Services | |||||||
| Establishments | 2,386 | 222 | 59 | 15 | 7 | * | 0 |
| Workers | 5,957 | 2,900 | 1,667 | 1,011 | 956 | * | 0 |
| Annual Pay | $43,513 | $46,140 | $46,496 | $32,409 | $47,281 | * | $0 |
| Total Private Ownership | |||||||
| Establishments | 32,320 | 4,085 | 2,657 | 725 | 309 | 96 | 32 |
| Workers | 75,031 | 55,045 | 78,643 | 49,447 | 46,029 | 31,336 | 41,450 |
| Annual Pay | $55,397 | $47,719 | $52,320 | $52,709 | $60,865 | $58,986 | $76,412 |
*Data was suppressed to prevent disclosure of confidential information. |
|||||||
