- Home to LMIC
- Virtual Labor Market Data System
- Career Exploration & Planning
- Consumer Price Index
- Demographics
- Economic Snapshot
- Employee Benefits
- Employment Projections
- Labor Force & Unemployment
- Labor Supply
- Overview of the Current Labor Market
- Surveys We Conduct
- Wages & Income
- Workers by Industry
- Tools & Resources
- Publications
- References
- What's New
- Can't Find It?
Labor Market Information Center
2023 Annual Report
Quarterly Census of Employment and Wages
Education and Health Services Supersector
The Education and Health Services supersector is comprised of the Education Services sector and the Health Services and Social Assistance sector. Businesses within this supersector provide instruction and training or provide health care and social assistance to individuals.
| South Dakota Covered Workers and Pay 2023 |
|||
| Supersector, Sector and Subsector | Number of Establishments | Average Number of Workers | Annual Pay |
| Education and Health Services | 3,552 | 72,218 | $63,171 |
| Educational Services | 539 | 3,966 | $34,597 |
| Educational Services | 539 | 3,966 | $34,597 |
| Health Care and Social Assistance | 3,013 | 68,253 | $64,830 |
| Ambulatory Health Care Services | 1,832 | 19,572 | $86,095 |
| Hospitals | 67 | 28,046 | $71,218 |
| Nursing and Residential Care Facilities | 347 | 11,827 | $38,641 |
| Social Assistance | 767 | 8,808 | $32,403 |
| Totals may not add due to rounding. Data subject to revision. Produced by the Labor Market Information Center, South Dakota Department of Labor and Regulation, in cooperation with the U.S. Bureau of Labor Statistics. |
|||
Educational Services
NAICS Sector 61
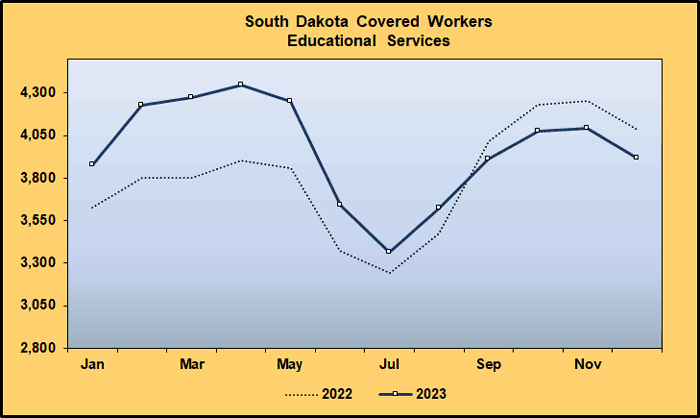
In 2023, the private Educational Services sector gained 158 workers (4.1%). The employment level was 3,966. The annual wage increased $1,256 (3.8%) from 2022 to 2023 to a new average of $34,597.
The Educational Services sector is made up of establishments providing instruction and training in a wide variety of subjects. This instruction and training is provided by specialized establishments, such as schools, colleges, universities, and training centers. Educational services are usually delivered by teachers or instructors who explain, tell, demonstrate, supervise, and direct learning. Instruction is imparted in diverse settings, such as educational institutions, the workplace, or the home and through diverse means, such as correspondence, television, the internet, or other electronic and distance learning methods.
The training provided by these establishments may include the use of simulators and simulation methods. It can be adapted to the needs of the students, for example sign language can replace verbal language for teaching students with hearing impairments. All industries in the sector share this commonality of process, namely, labor inputs of instructors with the requisite subject matter expertise and teaching ability. These establishments may also offer food and accommodation services to their students.
Educational Services is comprised of only one subsector. Within the subsector are the following industry groups:
- Elementary and Secondary Schools (NAICS 6111)
- Junior Colleges (NAICS 6112)
- Colleges and Universities (NAICS 6113)
- Business, Computer, and Management Training (NAICS 6114)
- Technical and Trade Schools (NAICS 6115)
- Other Schools and Instruction (NAICS 6116)
- Educational Support Services (NAICS 6117)
The largest employment gains occurred in Other Schools and Instruction, Educational Support Services, and Elementary and Secondary Schools. The remaining industry groups saw no significant change in employment levels during 2023.
Establishments in the Other Schools and Instruction industry group are primarily engaged in offering or providing instruction in diverse settings. These settings can be client’s training facilities, educational institutions, the workplace or at home. Instruction is also though diverse means such as correspondence, television, the Internet and other electronic and distance-learning methods. The most common settings in South Dakota are listed below:
- Fine Arts Schools
- Sports and Recreation Instruction
- Language Schools
- Exam Preparation
- Automobile Driving Schools
The Educational Services sector is widely considered counter-cyclical. Typically, when the economy is doing well and unemployment is very low, more working adults decide to go to work. More career and job prospects available for working adults, in turn, leads to lower enrollment, decreased profit, and a lower need for teachers/instructors at schools.
Establishments in this sector are privately owned and operated for profit or not for profit. Publicly owned establishments, usually owned and operated by state and local governments, are not included in this analysis. Statistics for those types of establishments are analyzed under the Public Administration supersector. Roughly 12% of the employment in Education Services falls in privately owned establishments, with the rest being in publicly owned establishments.

Health Care and Social Assistance
NAICS Sector 62
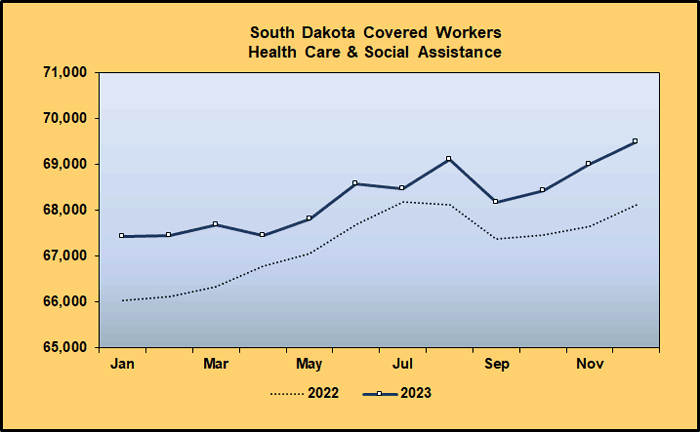
The Health Care and Social Assistance sector grew once again in 2023. Both employment and wages increased from 2022. Compared to other sectors, this sector has the highest amount of employment and largest amount of total wages paid out in South Dakota.
The number of workers reached 68,253, growing 1.5% from 2022. Average annual wages increased $1,713 (2.7%) to $64,830. This sector includes both health care and social assistance, because sometimes it is difficult to distinguish between the boundaries of these two activities. The Health Care and Social Assistance sector is made up of four subsectors.
- Ambulatory Health Care Services (NAICS 621)
- Hospitals (NAICS 622)
- Nursing and Residential Care Facilities (NAICS 623)
- Social Assistance (NAICS 624)
The Ambulatory Health Care Services subsector’s employment grew 1.5% to 19,572 in 2023. The annual average wage was $86,095, which is the highest of all four subsectors. Establishments provide health care services directly or indirectly to ambulatory patients and do not usually provide inpatient services. Employment gains were distributed evenly through most of the industry groups. The largest employment gains, percentage-wise, was seen in Outpatient Care Centers and Home Health Care Services.
The Hospitals subsector is comprised of establishments providing medical, diagnostic, and treatment services that include physician, nursing, and other health services to inpatients, and the specialized accommodation services required by inpatients. Hospitals may also provide outpatient services as a secondary activity. These establishments provide inpatient health services, many of which can only be provided using the specialized facilities and equipment that form a significant and integral part of the service-providing process.
Some of the largest establishments in South Dakota belong to the Hospitals subsector. The number of workers in 2023 increased by 0.5% to 28,046. This subsector’s average annual wage increased $1,652 (2.4%) to $71,218.
The Nursing and Residential Care Facilities subsector broke its trend and saw employment increase for the first time since 2019. Worker levels grew 0.7% to 11,827. The annual average wage grew 5.2% to $38,641. This subsector’s establishments provide residential care combined with either nursing, supervisory, or other types of care as required by the residents. Examples of facilities included in this subsector are nursing homes which have a permanent core staff of nurses along with other staff to provide nursing and continuous personal care services. Assisted and unassisted continuing care retirement community facilities are also part of this industry. Some of the residents need some nursing and personal care while others need limited services because they do not desire to live independently, so nursing care is not as vital. Care typically includes room, board, supervision, and assistance in daily living, such as housekeeping services. Although the demand for this type of care is high in South Dakota, establishments struggle to find and keep workers.
The Social Assistance subsector’s employment level increased by 501 workers (6.0%) to 8,808. Establishments provide a wide variety of social assistance services directly to clients. Child Care Services belong to this subsector. Establishments are primarily engaged in providing care and early learning opportunities for infants and children from birth through school age. After a slight decrease in 2022, Child Care Services saw employment grow in 2023. Individual and Family Services also saw significant employment growth. Business activities included providing nonresidential social assistance to children and youth, the elderly, persons with disabilities, and all other individuals and families.

