
- Home to LMIC
- Virtual Labor Market Data System
- Career Exploration & Planning
- Consumer Price Index
- Demographics
- Economic Snapshot
- Employee Benefits
- Employment Projections
- Labor Force & Unemployment
- Labor Supply
- Overview of the Current Labor Market
- Surveys We Conduct
- Wages & Income
- Workers by Industry
- Tools & Resources
- Publications
- References
- What's New
- Can't Find It?
South Dakota e-Labor Bulletin
July 2026
South Dakota Industry Employment Trends to 2034
South Dakota’s employment is expected to grow by about 38,559 jobs, or 7.4%, by the year 2034. This is faster than the projected national increase of 3.1% (about 5.2 million jobs). These projections are based on several statistical models that use historical employment data along with state and national economic trends.
The nationally used projections methodology assumes no major disasters, pandemics, or other events will occur during the projections period that would greatly disrupt economic activity during the projection period.
South Dakota’s future growth is supported by several factors: the state’s location, the rise of e-commerce, strong consumer demand, population growth, needs related to an aging population, and new technology. The total number of workers in South Dakota is expected to reach about 562,027 by 2034. This is an annual growth rate of 0.74%. Nationally, the U.S. Bureau of Labor Statistics (BLS) expects employment to reach about 175.2 million by 2034, which is an annual growth rate of 0.3%.
The 0.3% national annual growth rate is slower than the 1.3% annual growth seen from 2014 to 2024. The fastest national growth is expected in Healthcare and Social Assistance; Professional, Scientific, and Technical Services; and the Information sector. The main reasons for this growth are an aging population, more chronic health conditions, rising demand for artificial intelligence (AI) systems, data processing, software development, research services, and consulting.
Projections by category of workers
The South Dakota projections include three categories of workers:
- Non-agricultural Self-employed and Unpaid Family Workers
- Agriculture, Forestry, Fishing and Hunting Workers (Farm Employment)
- Nonfarm Wage and Salaried Workers
| South Dakota Wage and Salaried Workers by Industry Division 2024-2034 |
||||
| Industry Title | 2024 Workers |
2034 Workers |
Actual Change | Percent Growth |
| Total of All Industries | 523,468 | 562,027 | 38,559 | 7.4% |
| Non-agricultural Self-employed and Unpaid Family Workers | 24,399 | 25,801 | 1,402 | 5.7% |
| Agriculture, Forestry, Fishing and Hunting (Farm Employment) | 33,391 | 34,087 | 696 | 2.1% |
| Nonfarm Total Wage and Salaried Workers (excludes Self-employed and Unpaid Family Workers) |
465,678 | 502,139 | 36,461 | 7.8% |
| Source: Labor Market Information Center, South Dakota Department of Labor and Regulation, July 2026. | ||||
The Non-agricultural Self-employed and Unpaid Family Workers category is the smallest portion of the workforce in South Dakota. According to BLS, this includes people who work for profit or fees in their own business or trade. This group makes up 4.7% of the state’s workforce and is expected to grow 5.7% (0.57% annually). National growth for this group is projected at 0.2% annually.
Agriculture, Forestry, Fishing, and Hunting (Farm Employment) is another important part of the labor force. Employment in this group is expected to grow from 33,391 to 34,087 workers (2.1%) by 2034. That is an annual growth rate of 0.21%. Nationally, farm employment is expected to increase slightly by about 1,400.
The largest group is Nonfarm Wage and Salaried Workers, which makes up 89% of South Dakota’s workforce. This group is expected to grow by 7.8% by 2034. This category includes only those wage and salaried workers who are covered by unemployment insurance under the South Dakota Reemployment Assistance program and the Unemployment Compensation for Federal Employees (UCFE) program. It also includes those who work for non-profit organizations, such as private colleges and religious organizations.
Businesses are categorized into industries based on their primary business activity using the North American Industry Classification System (NAICS). Each digit level represents greater detail. NAICS categorizes businesses into one of 20 supersectors at a two-digit level.
Projections for goods-producing and service-providing industries
At the very broadest level, industry supersectors are categorized into one of two groups:
- Goods-producing, including the following supersectors:
- Natural Resources and Mining
- Construction
- Manufacturing
- Service-providing, including the following supersectors:
- Trade, Transportation, and Utilities
- Information
- Financial Activities
- Professional and Business Services
- Education and Health Services
- Leisure and Hospitality
- Other Services
- Public Administration
In 2024, service-providing industries made up 74.5% of South Dakota’s employment. They are expected to add about 29,832 workers by 2034, a growth rate of 7.6%. Goods-producing industries are also expected to grow, adding 7,325 workers (6.7%).
National projections show the Healthcare and Social Assistance sector growing the fastest, mainly due to an aging population and more chronic health conditions.
Projections at the broadest industry level within NAICS
South Dakota’s fastest-growing two-digit sectors are expected to be:
- Professional and Technical Services (13.3%)
- Arts, Entertainment, and Recreation (12.3%)
- Health Care and Social Assistance (11.9%)
- Transportation and Warehousing (11.8%)
- Construction (11.4%)
These sectors also include many of the top ten three-digit NAICS industries expected to grow the most by 2034.
Construction a good example of industry level break-down within NAICS
Construction is one example of how NAICS breaks down an industry. The two-digit Construction supersector NAICS 23 is broken down into more detailed three-digit subsectors:
- Construction of Buildings (NAICS 236)
- Heavy and Civil Engineering Construction (NAICS 237)
- Specialty Trade Contractors (NAICS 238)
Using Construction of Buildings (NAICS 236) from above, we can show how establishments are further broken down at the four-digit NAICS level:
- Residential Building Construction (NAICS 2361)
- Nonresidential Building Construction (NAICS 2362)
Top 10 Fastest-Growing Industries
The top 10 industries at the three-digit level which are projected to be the fastest growing to 2034 are highlighted below. Only those industry subsectors with at least 1,000 workers in 2024 were included.
| South Dakota Industry Employment Projections 2024-2034 Top Ten in Industry Growth |
|||||
| NAICS Code |
Industry Title | 2024 Workers |
2034 Workers |
Actual Change |
Percent Growth |
| 493 | Warehousing and Storage | 3,043 | 3,694 | 651 | 21.4% |
| 622 | Hospitals | 30,116 | 35,019 | 4,903 | 16.3% |
| 562 | Waste Management and Remediation Services | 1,066 | 1,235 | 169 | 15.9% |
| 492 | Couriers and Messengers | 2,473 | 2,852 | 379 | 15.3% |
| 237 | Heavy and Civil Engineering Construction | 4,602 | 5,241 | 639 | 13.9% |
| 541 | Professional, Scientific, and Technical Services | 18,300 | 20,731 | 2,431 | 13.3% |
| 621 | Ambulatory Health Care Services | 20,120 | 22,747 | 2,627 | 13.1% |
| 713 | Amusement, Gambling, and Recreation Industries | 5,841 | 6,590 | 749 | 12.8% |
| 336 | Transportation Equipment Manufacturing | 3,793 | 4,250 | 457 | 12.0% |
| 327 | Nonmetallic Mineral Product Manufacturing | 1,794 | 2,010 | 216 | 12.0% |
| Notes: Data is preliminary and subject to revision. Data for industries with 2024 employment less than 1,000 not included in the calculations. The calculations are based on percent change. Data presented for industries will not sum to totals due to non-publishable data for additional industries being included in totals. Industry Codes and Industry Titles are based largely on the North American Industry Classification System (NAICS). See descriptions of NAICS codes. Source: Labor Market Information Center, South Dakota Department of Labor and Regulation. |
|||||
Warehousing and Storage
Employment is expected to grow by 21.4% (651 workers). Businesses in this subsector, sometimes called fulfillment centers, operate warehousing and storage facilities for general merchandise, refrigerated goods, and other products and prepare them for shipment to consumers. Growth is driven by continually rising e commerce and South Dakota’s central location with strong transportation routes via highway, rail, and air.
Hospitals
Employment is projected to grow by 16.3% (4,903 workers). Hospitals provide medical, diagnostic, and treatment services to inpatients. They may also provide outpatient services as a secondary activity. Growth will be driven by population increases and an aging population. From 2020 to 2024, the state added about 40,454 residents. According to American Community Survey (ACS) one-year estimates from the U.S Census Bureau, South Dakota’s population 65 years and older increased by 19,953 people (2020 to 2024). The 65+ category made up 17.6% of the population in 2020, which jumped to 19.0% by 2024. Census data for 2025 shows the trends continued.
Waste Management and Remediation Services
The number of workers in South Dakota’s Waste Management and Remediation Services subsector is projected to increase by 15.9% (169 workers) over the next 10 years. Establishments here collect, treat, and dispose of waste materials. This includes local hauling of waste materials, operating materials recovery facilities, providing remediation services, and providing septic pumping and other miscellaneous waste management services. Growth is linked to population increases, development, regulations, and demand for clean and safe facilities.
Couriers and Messengers
Employment is expected to grow 15.3% (379 workers). Businesses in this subsector provide intercity, local, and/or international delivery of parcels and documents. This subsector is closely connected to the Warehousing and Storage subsector since products stored in warehouses ultimately need to be delivered to final consumers.
Heavy and Civil Engineering Construction
Heavy and Civil Engineering Construction employment is projected to grow 13.9% (639 workers). Many companies in this subsector are responsible for entire engineering projects like highways and dams. It also includes specialty trade contractors who focus on a specific component of these big projects (like painting highway lines). Growth in this subsector comes from population increases, an escalating need for infrastructure repair, and economic development. Several four digit industries within this subsector are expected to see double digit growth by 2034:
- Highway, Street, and Bridge Construction
- Utility System Construction
- Other Heavy and Civil Engineering
Professional, Scientific, and Technical Services
South Dakota’s Professional, Scientific, and Technical Services subsector is projected to grow 13.3% (2,431 workers). These businesses provide the specialized knowledge and skills of their employees, often on an assignment basis, where an individual or team is responsible for the delivery of services to the client. The individual industries of this subsector are defined by a particular expertise and training of the service provider. Six out of nine four digit industries in this subsector are expected to grow by double digits. The strongest growth is expected in Computer Systems Design and Related Services and in Management, Scientific, and Technical Consulting Services (both above 17%). Growth is driven by automation, new technology, and increasing need for specialized expertise and consulting services.
Retailers and fast-food chains are cutting labor costs through self-checkout systems and online, app-based, or kiosk ordering options, further increasing dependence on technical and consulting services.
Ambulatory Health Care Services
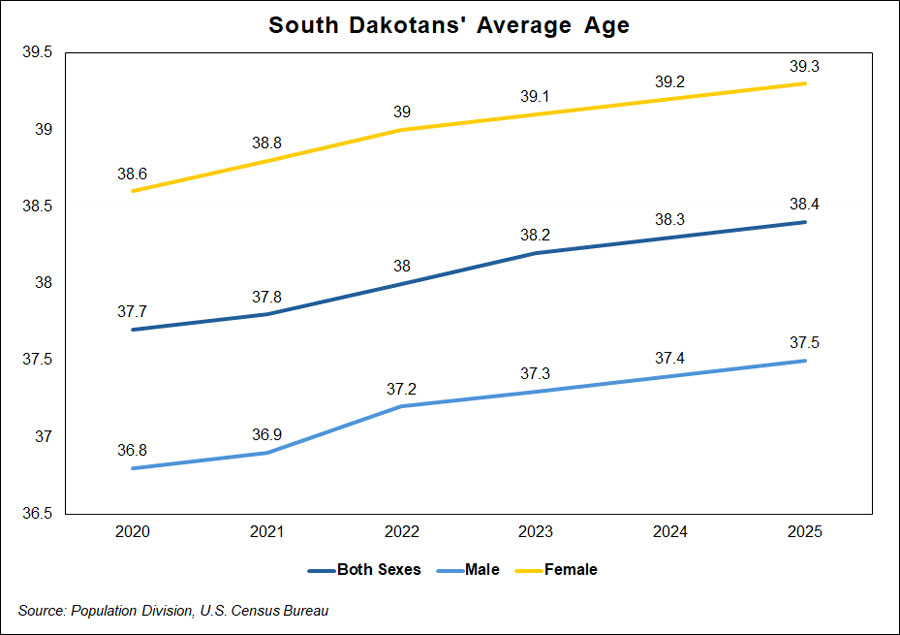
The number of workers in South Dakota’s Ambulatory Health Care Services subsector is projected to increase by 13.1% (2,627 workers) over the next 10 years. These businesses provide health care services to ambulatory patients (those who can walk or move on their own), normally on an outpatient basis. Growth is tied to population aging and general population growth. According to the U.S. Census Bureau, South Dakota’s median age rose from 37.7 in 2020 to 38.4 in 2025. The chart below illustrates the median age of combined sexes, males, and females in South Dakota.
Amusement, Gambling, and Recreation Industries
Employment in South Dakota’s Amusement, Gambling, and Recreation Industries subsector is projected to grow 12.8% (749 workers). This includes facilities for sports, recreation, amusement, and gambling. Examples include golf courses, country clubs, skiing facilities, fitness and recreational sports centers, and bowling centers. A four-digit industry underneath this subsector, Other Amusement and Recreation, is expected to have double-digit percentage employment gains. The demand for recreation and amusement is strong in South Dakota. In 2024, the Department of Tourism reported 14.9 million visitors spent about $5 billion. Visitor spending has increased by about 24.1% since 2019.
Transportation Equipment Manufacturing
Employment in the Transportation Equipment Manufacturing subsector is expected to grow 12% (457 workers). These manufacturers produce equipment for transporting people and goods. They use production processes similar to those of other machinery manufacturing establishments, such as forming, welding, machining, and assembling parts into components and finished products. Growth will be driven mainly by Motor Vehicle Body and Trailer Manufacturing and Motor Vehicle Parts Manufacturing, both expected to grow more than 10% due to increased consumer demand for products like utility trailers and automobile filtration products.
Nonmetallic Mineral Production Manufacturing
The Nonmetallic Mineral Production Manufacturing subsector is projected to increase employment by 12.0% (216 workers). These businesses mine or quarry materials like sand, gravel, stone, clay, and refractory materials to create products for intermediate or final consumption. Processes used include grinding, mixing, cutting, shaping, and honing. Growth is closely tied to construction and infrastructure demand. As construction increases in South Dakota, demand for these materials rises.
Want more information?
The 2024 to 2034 projections data for all industries in South Dakota is available from our Industry Projections menu in several options: in our online data system (with options including filtering and exporting), as well as PDF or Excel file downloads. Contact us with questions or for assistance as needed.