
- Home to LMIC
- Virtual Labor Market Data System
- Career Exploration & Planning
- Consumer Price Index
- Demographics
- Economic Snapshot
- Employee Benefits
- Employment Projections
- Labor Force & Unemployment
- Labor Supply
- Overview of the Current Labor Market
- Surveys We Conduct
- Wages & Income
- Workers by Industry
- Tools & Resources
- Publications
- References
- What's New
- Can't Find It?
South Dakota e-Labor Bulletin
December 2025
Where demographic data meets the road
Numbers on South Dakota license plate: what do they mean?
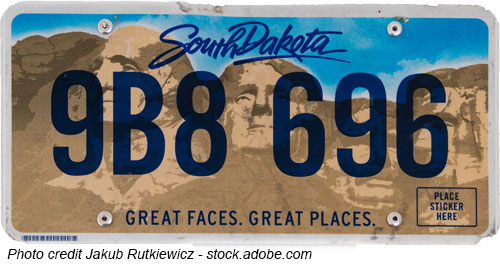 Did you know the first number on a South Dakota license plate identifies what county the vehicle was registered in? For example, a license plate beginning with a ‘3’ was registered in Brown County; one beginning with ‘43’ was registered in Lake County. The county code first is followed by a letter to differentiate it from the rest of the plate number. If you compare plates for various counties, it may seem the numbers were randomly assigned. But there is a system.
South Dakota’s present-day county coding system began in 1956. The numbers 1-9 were assigned to the largest counties based on population. Beginning with 10, numbers were assigned to the remaining counties in alphabetical order.
Today there are only 66 counties in South Dakota, but the license plate numbers go from 1 to 67. And Ziebach County is not #66. What gives?
The number 66 was originally assigned to Washabaugh County, which was absorbed into Jackson County (39) in 1983. When the numbers were originally assigned, Oglala County (65) and Todd County (67) were not incorporated so were added later at the end of the numerical list.
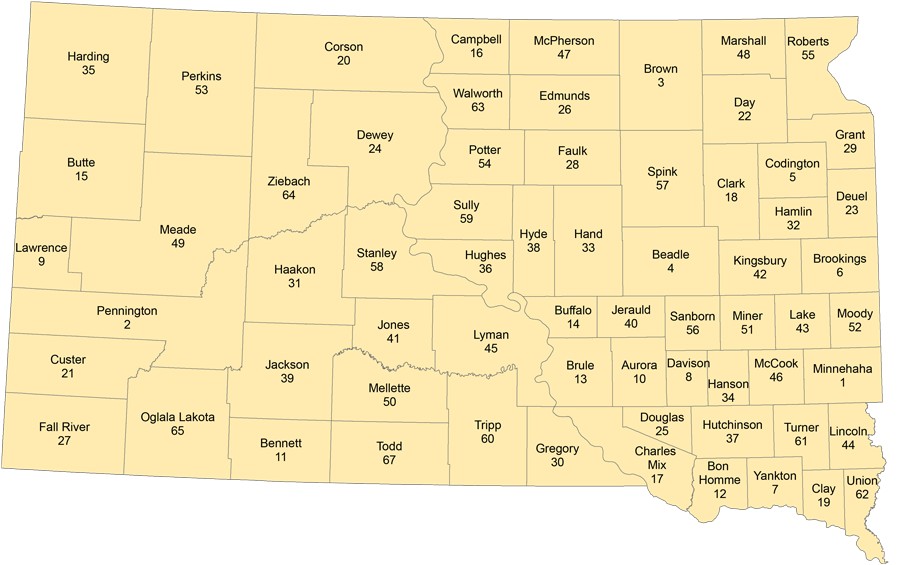
County codes used on South Dakota license plates
Population Changes
South Dakota’s population distribution has changed significantly since the license plate numbering system was established. If the numbers were assigned today, Minnehaha County would still be ‘1’ and Pennington County would still be ‘2’; but Lincoln County would move from ‘44’ to ‘3’. The table below shows what the top nine counties were in 1956 and what they would be today based on 2024 population figures. Beadle and Davison counties fell out of the top nine, replaced by Lincoln and Meade counties.
| 1956 | 2024 | ||
| Plate # | County | Plate # | County |
| 1 | Minnehaha County | 1 | Minnehaha County |
| 2 | Pennington County | 2 | Pennington County |
| 3 | Brown County | 44 | Lincoln County |
| 4 | Beadle County | 3 | Brown County |
| 5 | Codington County | 6 | Brookings County |
| 6 | Brookings County | 49 | Meade County |
| 7 | Yankton County | 5 | Codington County |
| 8 | Davison County | 9 | Lawrence County |
| 9 | Lawrence County | 7 | Yankton County |
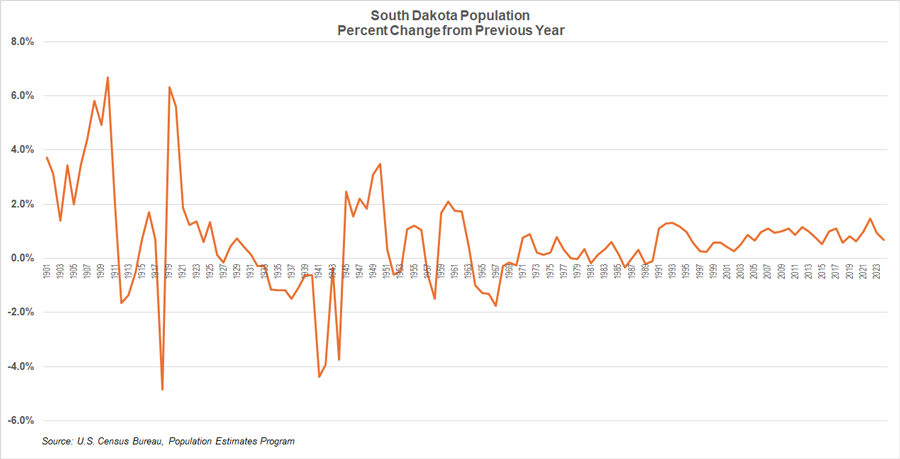
The line graph below shows the great variation of South Dakota’s population trends since 1900. The population has grown since the 1990s. Since 2000, the growth rate has averaged 0.8% per year. If that rate continues, our population will surpass 1 million in the year 2034.
Let’s take a deeper look at South Dakota’s population changes between 2000 and 2024. South Dakota’s 2000 population estimate was 755,000, 170,000 less than the 2024 estimate of 925,000. The majority of the population growth over this time period was concentrated in the Metropolitan Statistical Areas (MSAs). Together, the Rapid City and Sioux Falls MSAs accounted for 87% or 148,000 of the total growth.
The Sioux Falls MSA is the fastest-growing area in South Dakota, with population increasing by 66% since 2000. Rock County of Minnesota was added to the Sioux Falls MSA beginning in 2023, but for this article, we’re focusing on just the South Dakota counties.
Combined, the MSAs are made up of seven counties. The Sioux Falls MSA consists of Minnehaha, Lincoln, Turner, and McCook counties; the Rapid City MSA is made up of Pennington, Meade, and Custer counties. Five of the top 10 counties with the most growth since 2000 belong to one of the MSAs, but the top spot goes to Lincoln County with growth of 212%, increasing by 51,000 from 2000 to 2024.
| Total Population by Area | ||||
| Area | 2000 | 2024 | Net Change 2000 to 2024 |
Percent Change 2000 to 2024 |
| South Dakota | 755,000 | 925,000 | 170,000 | 23% |
| Sioux Falls MSA | 187,000 | 299,000 | 112,000 | 60% |
| Rapid City MSA | 120,000 | 156,000 | 36,000 | 30% |
| Balance of State | 448,000 | 470,000 | 22,000 | 5% |
| Balance of State Percent of Total | 59% | 51% | 13% | |
| Source: U.S. Census Bureau, Population Estimates Program | ||||
County Population
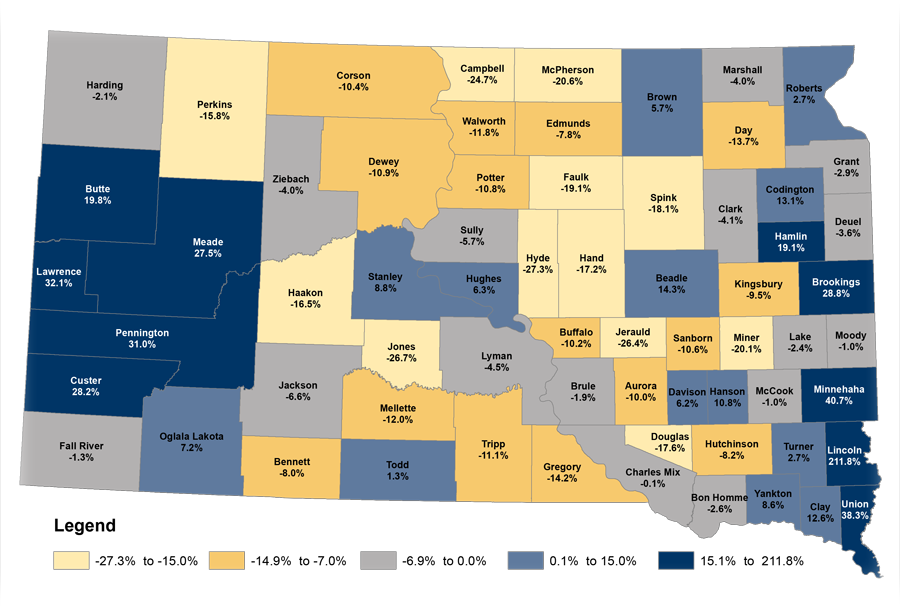
Only 24 of South Dakota’s 66 counties have experienced population growth since 2000, indicating current residents are migrating to and new residents are choosing to live in more urban areas.
There are 59 counties in South Dakota that are not part of one of the MSAs. Combined, those counties grew by only 5% between 2000 and 2024. In 2000, they made up 59% of the population; by 2024, that percentage dropped to 51%.
County percent changes in population 2000 to 2024
City Population
Based on 2024 population, 14 South Dakota cities each has more than 10,000 residents. Roughly 52% of South Dakota’s total population resides in one of these 14 cities.
The three largest cities are Sioux Falls, Rapid City, and Aberdeen. These three cities have held the top spots since 2000, but the remaining cites in the top 10 have changed positions since 2000. Due to its close proximity to Sioux Falls’ rapidly expanding southeast side, the city of Harrisburg in Lincoln County has had the most significant growth over the years. Its population grew from just 950 residents in 2000 to 10,200 in 2024, an astounding growth of 974%. The city of Tea has also had considerable growth due to its close proximity to Sioux Falls, increasing from 1,700 in 2000 to 7,600 in 2024, 331%. If the current growth trend continues, Tea will reach the 10,000 resident mark within the next few years.
| South Dakota City Population | ||||||
| Area | 2000 | 2000 Rank |
2024 | 2024 Rank |
Net Change 2000 to 2024 |
Percent Change 2000 to 2024 |
| Sioux Falls | 124,750 | 1 | 209,300 | 1 | 84,550 | 68% |
| Rapid City | 60,800 | 2 | 79,900 | 2 | 19,100 | 31% |
| Aberdeen | 25,300 | 3 | 27,900 | 3 | 2,600 | 10% |
| Brookings | 18,800 | 5 | 24,550 | 4 | 5,750 | 31% |
| Watertown | 20,350 | 4 | 23,500 | 5 | 3,150 | 15% |
| Yankton | 13,500 | 8 | 15,650 | 6 | 2,150 | 16% |
| Mitchell | 14,650 | 6 | 15,600 | 7 | 950 | 6% |
| Huron | 11,950 | 9 | 14,500 | 8 | 2,550 | 21% |
| Box Elder | 7,550 | 12 | 13,900 | 9 | 6,350 | 84% |
| Spearfish | 8,850 | 11 | 13,800 | 10 | 4,950 | 56% |
| Pierre | 13,900 | 7 | 13,800 | 10 | -100 | -1% |
| Vermillion | 10,250 | 10 | 11,900 | 12 | 1,650 | 16% |
| Brandon | 5,700 | 13 | 10,850 | 13 | 5,150 | 90% |
| Harrisburg | 950 | 14 | 10,200 | 14 | 9,250 | 974% |
| Source: U.S. Census Bureau, Population Estimates Program | ||||||
South Dakota Compared to Other States
Compared to the states directly bordering us, South Dakota has the third fastest growth rate (22%) since 2000. Montana had the highest rate at 26% and Iowa the lowest at only 11%.
| Population of Surrounding States | ||||
| Area | 2000 | 2024 | Net Change 2000 to 2024 |
Percent Change 2000 to 2024 |
| Montana | 903,293 | 1,137,233 | 233,940 | 26% |
| North Dakota | 641,200 | 796,568 | 155,368 | 24% |
| South Dakota | 755,694 | 924,669 | 168,975 | 22% |
| Wyoming | 493,958 | 587,618 | 93,660 | 19% |
| Minnesota | 4,933,958 | 5,793,151 | 859,193 | 17% |
| Nebraska | 1,713,345 | 2,005,465 | 292,120 | 17% |
| Iowa | 2,928,184 | 3,241,488 | 313,304 | 11% |
| Source: U.S. Census Bureau, Population Estimates Program | ||||
Where are people coming from?
The most recent migration data available from the U.S. Census Bureau are the 2022 American Community Survey one-year estimates. In 2022, roughly 31,300 people moved to South Dakota from other states, while 28,800 moved out of the state, a net migration gain of 2,500. South Dakota gained the most residents from Minnesota and Iowa. Surprisingly, Georgia snuck into the third spot from where residents migrated. More surprises pop up on the list, with Oregon, Washington, and California making it into the top ten of states whose citizens moved to South Dakota.
South Dakota is an attractive place to live due to it’s low cost of living, no state income tax, and business-friendly environment. South Dakota’s comparatively low population density and ‘open for business’ approach during the recent COVID-19 pandemic also drew new residents. Of additional appeal are the many outdoor activities South Dakota offers in all four seasons.
| Top Ten States of Prior Residence | |
| State | Number of Residents |
| Minnesota | 6,934 |
| Iowa | 2,939 |
| Georgia | 2,134 |
| Nebraska | 2,109 |
| Wyoming | 1,512 |
| Arizona | 1,446 |
| Montana | 1,363 |
| Oregon | 1,314 |
| Washington | 1,001 |
| California | 957 |
| Source: U.S. Census Bureau, 2022 American Community Survey 1-year estimates. |
|