- Home to LMIC
- Virtual Labor Market Data System
- Career Exploration & Planning
- Consumer Price Index
- Demographics
- Economic Snapshot
- Employee Benefits
- Employment Projections
- Labor Force & Unemployment
- Labor Supply
- Overview of the Current Labor Market
- Surveys We Conduct
- Wages & Income
- Workers by Industry
- Tools & Resources
- Publications
- References
- What's New
- Can't Find It?
South Dakota e-Labor Bulletin
August 2025
Celebrating Labor on Labor Day

Labor Day is Monday, Sept. 1. It’s the perfect time for us to share some facts about the people who work in South Dakota.
After all, the holiday was created to celebrate workers. The first Monday in September was recognized as a federal holiday on June 28, 1894, when President Grover Cleveland signed it into law. Did you know a South Dakotan helped make it happen? Senator James Kyle introduced the bill in the U.S. Senate. Even before then, many states and labor groups were already honoring workers with their own celebrations.
Back then, there were no official labor force statistics like we produce today. The 1890 Census pegged South Dakota’s population at 328,808. Reportedly, almost 90% of men 15 and older were working, while only about 11% of women 16 and older had jobs, often in factories, domestic work, or teaching. According to a BLS article on the history of child labor, child labor was also common. In 1870, one in eight children worked. By 1900, it was more than one in five, before child labor laws were created in 1916.
Today, South Dakota’s population is about 925,000—nearly three times more than when Labor Day began. The state had one of the highest labor force participation rates in the nation at 69.5% in 2024. Although there are now various federal laws to protect them, many South Dakota youth still work—64.5% of those ages 16–24 in 2024, compared to 55.9% nationwide. Many seniors also remain active in the workforce. The labor force participation rate for South Dakotans 65 and older was 28.7% in 2024, compared to the national rate of 19.5%.
South Dakota’s labor force is currently 493,300 people strong—with 484,100 employed and 9,200 unemployed and actively looking for work. Some even work more than one job. In 2024, about 32,000 South Dakotans did so, a rate of 6.5% compared to 5.2% nationally.
Where do South Dakotans work?
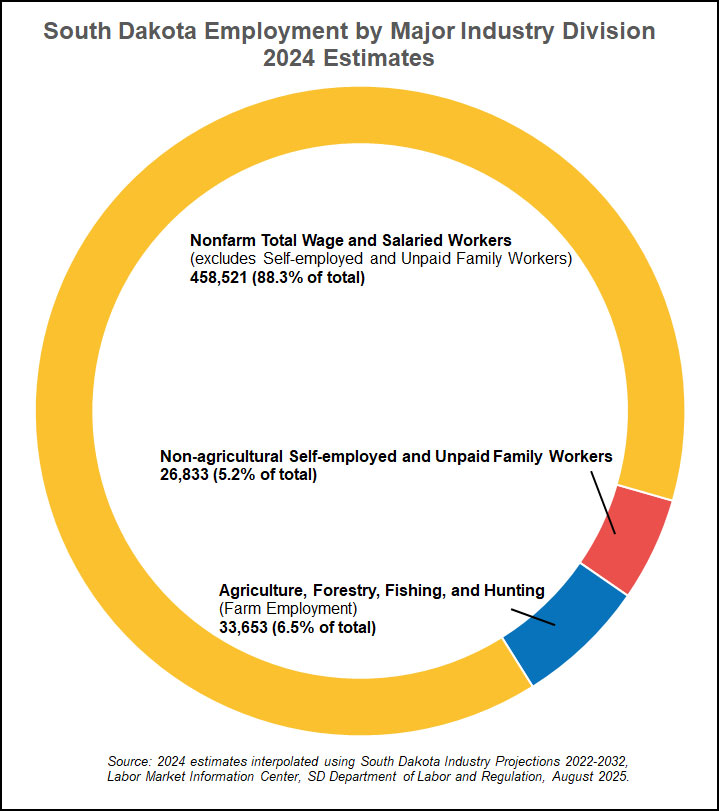
- About 33,000 (6.5%) work in farming, ranching, fishing, and related jobs.
- About 27,000 (5.2%) are self-employed or unpaid family workers in other businesses.
- Most people—over 458,000 (88.3%)—work for wages or salaries in non-farm businesses.

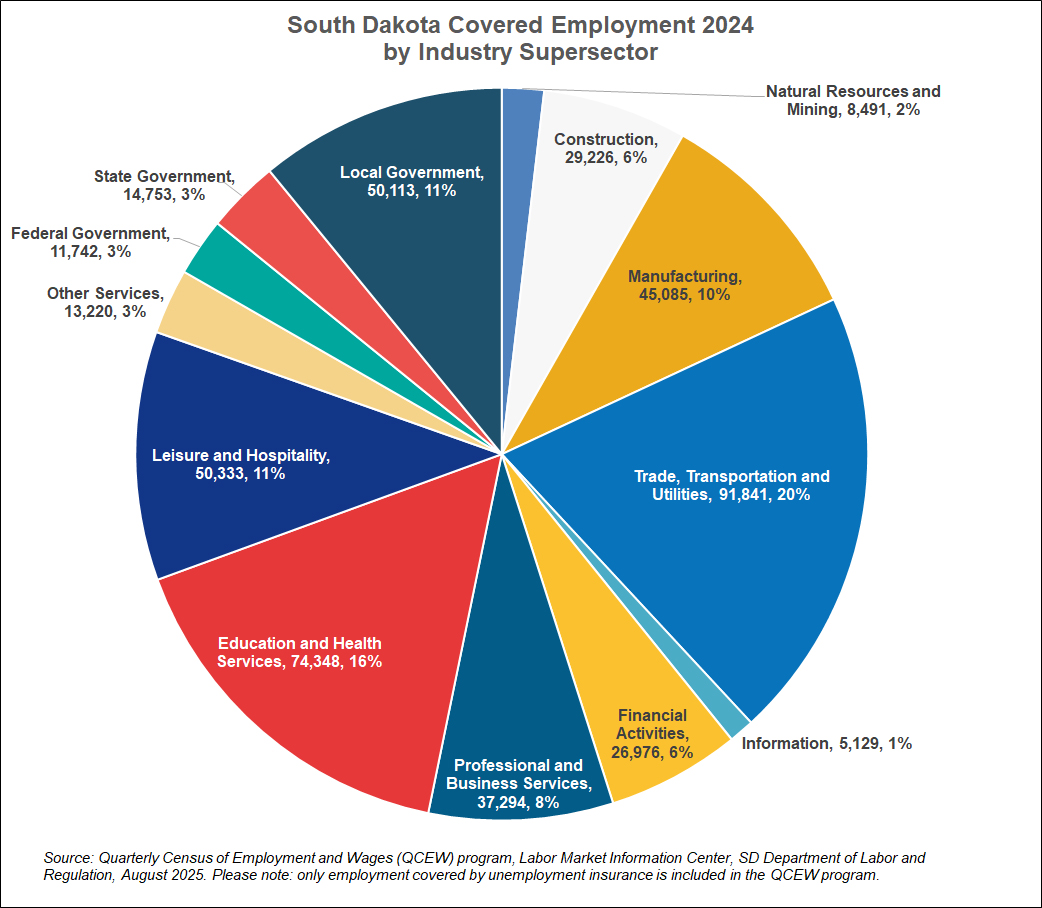
For more details on the industries where South Dakota’s wage and salaried workers are employed, see the pie chart below. Trade, Transportation, and Utilities is the largest, with nearly 92,000 workers (about 1 in 5). Next is Education and Health Services, with nearly 75,000 workers (16%).

For More Information
The data incorporated above are just a few examples of the type of demographic and workforce information available from the Labor Market Information Center. For additional labor market information, contact us.
