- Home to LMIC
- Virtual Labor Market Data System
- Career Exploration & Planning
- Consumer Price Index
- Demographics
- Economic Snapshot
- Employee Benefits
- Employment Projections
- Labor Force & Unemployment
- Labor Supply
- Overview of the Current Labor Market
- Surveys We Conduct
- Wages & Income
- Workers by Industry
- Tools & Resources
- Publications
- References
- What's New
- Can't Find It?
South Dakota e-Labor Bulletin
June 2022
Quarterly Census of Employment and Wages:
the premier data slicer/dicer

A comprehensive summary of detailed 2021 South Dakota employment and wage data is now available through the Quarterly Census of Employment and Wages (QCEW) program. We conduct the QCEW program in cooperation with the U.S. Bureau of Labor Statistics. It is the most comprehensive source of data (hence the term “census”) on the number of establishments and workers as well as pay.
Humor us and imagine the QCEW program as a huge magic dicing tool, like one used to dice fruits or vegetables. Only the QCEW program slices and dices data. Feeding into the dicing tool are reports submitted quarterly to the Department of Labor and Regulation by South Dakota employers liable for unemployment insurance tax. Each employer report details the following:
- How many workers were employed each month in the quarter
- The total payroll paid to those workers
As each South Dakota employer becomes liable for unemployment insurance tax, we identify:
- What industry the business falls into
- The location of the employer
 Picture each of those four data items feeding into the magic slicer/dicer tool. Now visualize the output: the information coming out of the slicer/dicer. It may be easier to visualize a table format—rows and columns of the data that has been combined, summed and calculated in the magic tool. As a result, we know the following about South Dakota employers:
- Number of establishments
- Number of workers
- Annual pay
Because of the other details fed into the magic slicer/dicer, we know each of the items listed above by the following:
- Industry
- Area
- Establishment size
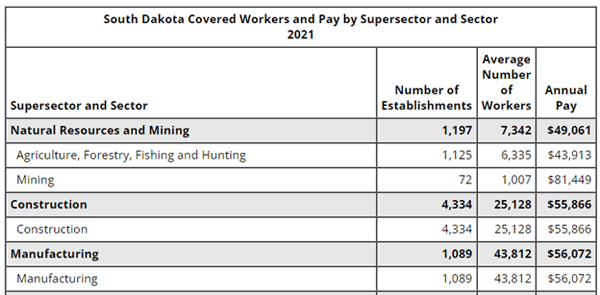
Number of Establishments, Workers and Pay by Industry
The graphic below shows an example of the resulting table including number of establishments, number of workers and annual pay for a few select industries. See the full table for all industry sectors in the 2021 summary.

Additionally, the Annual Summary includes an overview of each industry sector, including tables, graphs and narrative analysis.
Number of Establishments, Workers and Pay by Area
Tables showing the number of establishments, workers and pay are included in the annual QCEW summary for not just statewide South Dakota, but for each of the state’s Metropolitan Statistical Areas (MSAs) and all 66 counties as well.
For each MSA (Rapid City and Sioux Falls), tables show the number of establishments, workers and annual pay. As for data available by county, see the table of employment levels by county and the table of annual pay by county.
Establishments, Workers and Pay by Size Class
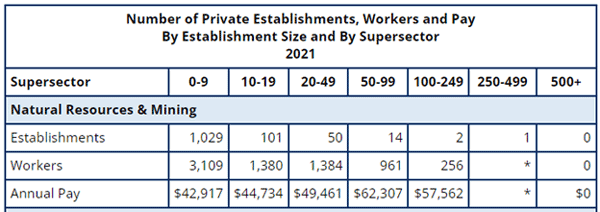
Yet another output of the QCEW program (and the only source of such data) is data by employer size class. For example, the 2021 summary shows the predominance of small employers in South Dakota. Employers with 0-9 workers account for nearly 80 percent of all establishments. On the flip side, we see those smallest businesses employed just 20.2 percent of the covered workers in South Dakota in 2021.
The establishment, employment and pay data by employer size class is “sliced and diced” yet another way, by industry, as shown in the graphic below featuring data for the Natural Resources & Mining industry. See the full table including all industries.

Adding yet another dimension to the depth of employer size data available in the annual summaries of QCEW data, the size class data is also available at the county level. And for each of the metro areas (Rapid City and Sioux Falls), the employer size class data is provided by industry group.
We hope this has whet your appetite for the depth of state-specific employment and wage data available in the 2021 Summary of QCEW data. Did we mention the annual summaries are available on our website back to 2004? (They are available in print back to 1980, so simply contact us if you need older data.) Interested in quarterly data? You can find it as well as annual data in the virtual labor market data system. Just start from our QCEW menu page, looking under the heading "Retrievable Data." Just below the link to get QCEW data from the virtual system, you’ll also find a link to step by step instructions for finding the data you need in the virtual system. Contact us as needed for assistance or with questions.
