- Home to LMIC
- Virtual Labor Market Data System
- Career Exploration & Planning
- Consumer Price Index
- Demographics
- Economic Snapshot
- Employee Benefits
- Employment Projections
- Labor Force & Unemployment
- Labor Supply
- Overview of the Current Labor Market
- Surveys We Conduct
- Wages & Income
- Workers by Industry
- Tools & Resources
- Publications
- References
- What's New
- Can't Find It?
South Dakota e-Labor Bulletin
July 2022
Tracking South Dakota worker comings and goings
Where are new South Dakota workers coming from? Where are healthcare workers and educators moving? Are people leaving the labor force in South Dakota, changing jobs or not working?
Job-to-Job (J2J) flow statistics, produced using the Longitudinal Employer Household Dynamics (LEHD) data from the U.S. Census Bureau, can help answer some of these burning questions. The J2J statistics on hires and separations focus on worker reallocation across employers throughout the United States by providing data on job transition rates as well as worker flows in and out of employment. J2J data is broken out by firm characteristics (industry, age and size) and worker characteristics (sex by age, sex by education and race by ethnicity) and is available nationally, by state and by MSA.
Data users can download public use files, which are available in both Excel and CSV formats, or users can query and visualize the data using the J2J Explorer accessible via the LEHD home page. J2J Explorer data can be visualized using tables, charts, graphs and maps. Data can also be exported into tables, charts and graphs depending on the visualization selected.
J2J statistics are produced and published on a quarterly schedule with a three-quarter lag. Data availability varies by indicator, depending on the leading and lagging data needed for calculation. National data are available from second quarter 2000 to the latest available production quarter (which is currently second quarter 2021). Data availability at the substate level can vary by state, depending on the availability of unemployment insurance data. For more detailed information on this dataset please see the J2J information sheet on the U.S. Census Bureau’s website.
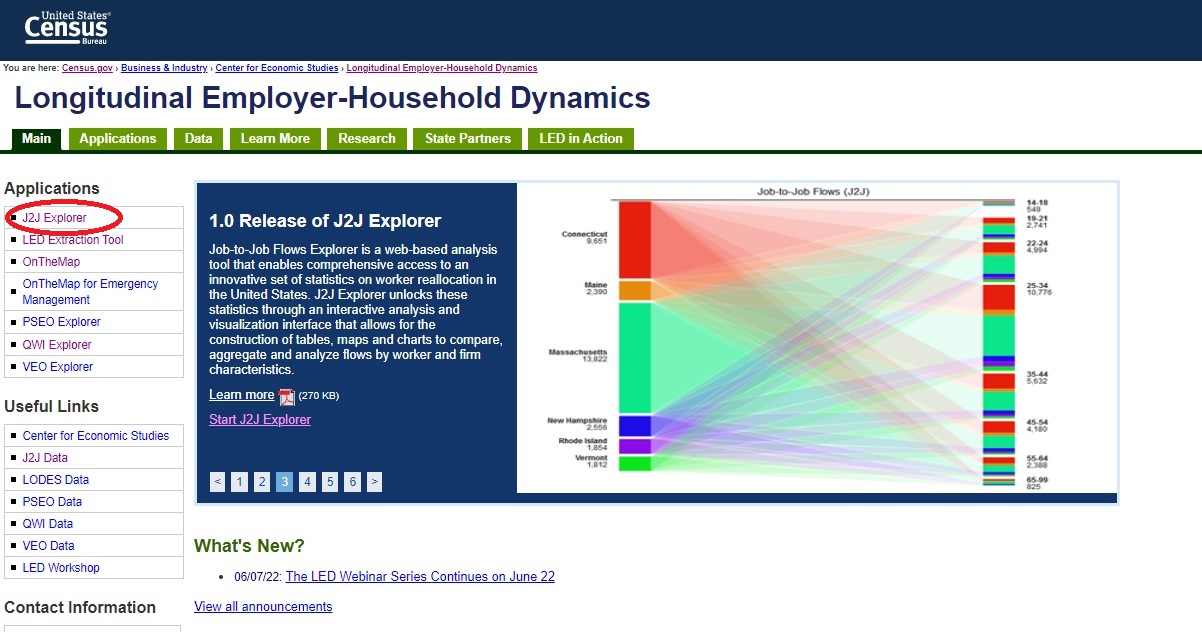
The J2J explorer can be accessed from the LEHD home page by selecting the J2J link under the applications on the left side of the page.
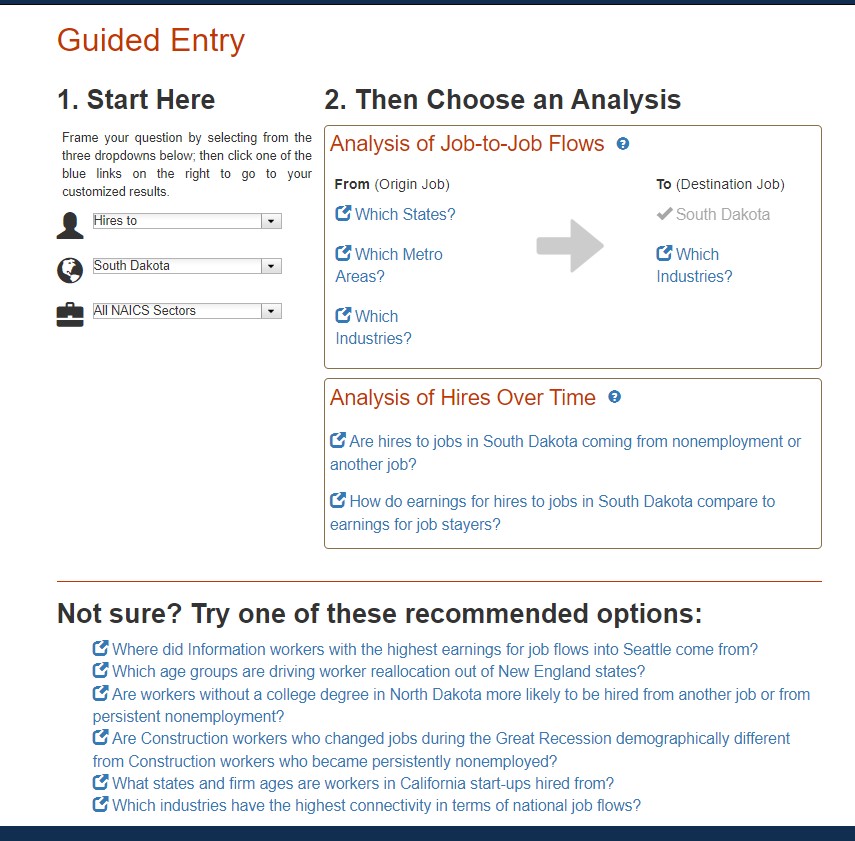
The J2J Explorer begins with a guided entry to help users find the data they are looking for while giving some awareness of the data available within the application. Users begin by selecting whether they want to look at hires or separations. Users then select the geography and industry sector (using the North American Industry Classification System (NAICS). The next step allows the user to select the type of analysis such as where workers are going or what industries they are going to. If a user is not sure what they are looking for there are some recommended options under the guided entry, giving users an idea of questions that can be answered by the application.
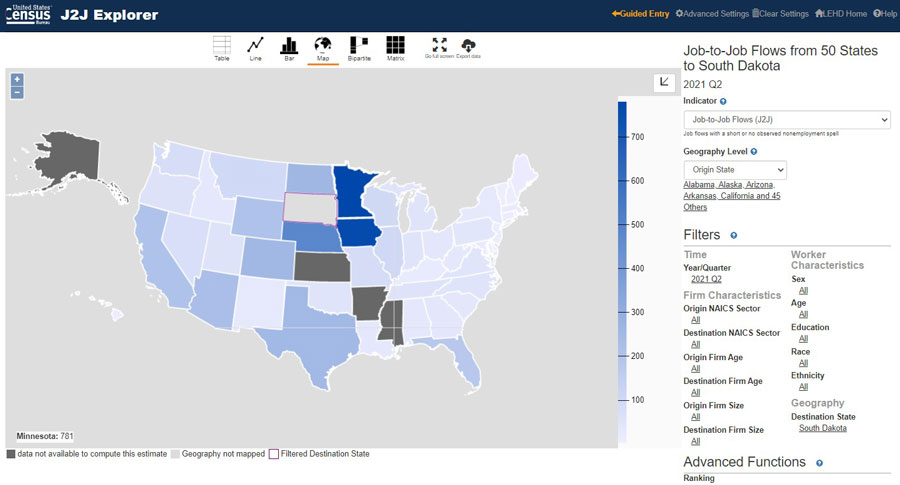
Let’s look at where new South Dakota workers are coming from. To begin select Hires to, South Dakota, all NAICS sectors. Under the analysis section choose ‘Which States?’.
The results display in a gradient color map. The time period defaults to the most recent quarter of data available, which for this example is the second quarter of 2021. From the results we can see the largest number of workers came from Minnesota (781) followed by Iowa (764) and Nebraska (488). To see the number of workers from each state simply hover over the state in question and the number will display in the lower left corner of the map. There are four states with no data available because they are not currently LEHD partners. Those states are Alaska, Kansas, Arkansas and Mississippi.
From the initial results displayed on a map, the data can be viewed in different formats (Table, Line Graph, Bar Chart, Bipartile and Matrix), which can be chosen from the list displayed above the map. To the right of the map are several different filters that can be used to manipulate the data to find more detailed information such as specific industries, firm size, worker education, age and sex.
The following tables show the movement of workers between states in the Healthcare and Social Assistance industry sector in second quarter 2021. Figure 1 displays the top 10 states in which workers moved to South Dakota. Figure 2 displays the top 10 states to which South Dakotans moved to.
| Top Ten States New Healthcare Workers Came From | |
| Minnesota | 75 |
| Iowa | 47 |
| Nebraska | 27 |
| Colorado | 26 |
| North Dakota | 14 |
| California | 11 |
| Texas | 9 |
| Arizona | 9 |
| Missouri | 8 |
| Wyoming | 7 |
| Source: U.S. Census Bureau, Longitudinal-Employer Household Dynamics Program Job-to-Job Flows (2000-2021) second quarter 2021, accessed July 2022 at https://j2jexplorer.ces.census.gov. | |
| Top Ten States Healthcare Workers Moved To | |
| Minnesota | 75 |
| Iowa | 47 |
| Nebraska | 27 |
| North Dakota | 26 |
| Colorado | 14 |
| Texas | 11 |
| California | 9 |
| Washington | 9 |
| Wyoming | 8 |
| Missouri | 7 |
| Source: U.S. Census Bureau, Longitudinal-Employer Household Dynamics Program Job-to-Job Flows (2000-2021) second quarter 2021, accessed July 2022 at https://j2jexplorer.ces.census.gov. | |
This detailed data is attainable by choosing the ‘Healthcare and Social Assistance’ sector in the origin and destination filters. Also, under the advanced functions, data can be ranked to include the top or bottom 10, 25 or 50 for a specified axis.
Users can also use this application to look at whether those who are separating from their jobs are changing jobs or moving into persistent non-employment. Persistent non-employment is defined as the lack of a main job with any employer by State Employer Identification Number (SEIN) for two consecutive points in time (i.e. the beginning and end of a given quarter). An individual can receive earnings from one or more single quarter jobs in a given quarter while persistently being non-employed. The example below shows separations in South Dakota in the second quarter for the years 2000-2021. The top line represents total separations, the middle line represents job-to-job separations, and the bottom line is separations to persistent non-employment.
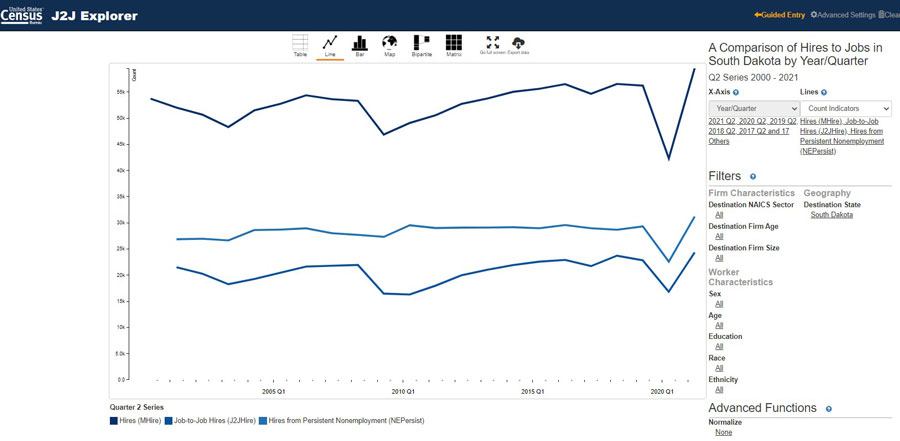
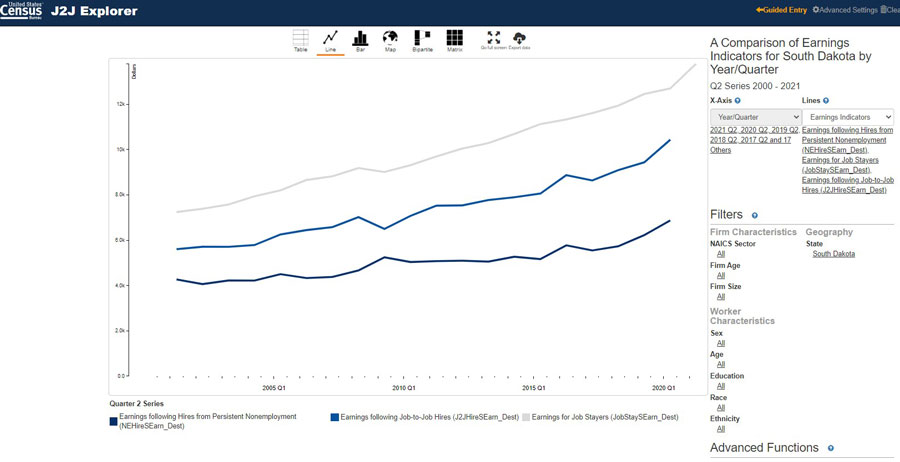
This data can be filtered by several different characteristics, as seen on the right side of the graph, including various firm and worker characteristics. Earnings indicators allow users to look at earnings for: Earnings following Hired from Persistent non-employment, Earnings following Job-to-Job Hires and Earnings for Job Stayers. The graph below depicts second quarter earnings for workers in those the previously mentioned categories.
This dataset, although it does have some lag time, produces timely data for some of today’s most asked questions regarding workers in South Dakota and across the country. Check it out today to see if it can assist. Help and documentation for J2J data can be found on the Census Bureau's website. You can also email the U.S. Census Bureau with any questions at CES.j2j.Feedback@census.gov or contact them at 800.923.8282.

